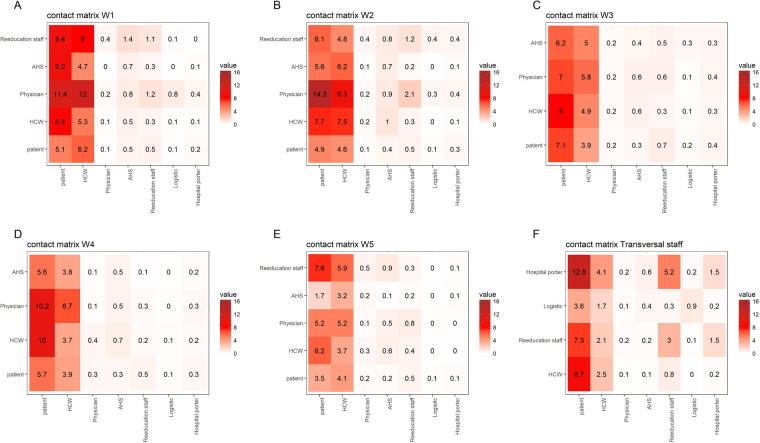
Figure 3.
Ward-specific averaged daily distinct CPI frequency patterns between categories of individuals. Contact matrices are provided for (A) neurologic rehabilitation ward W1, (B) neurologic rehabilitation ward W2, (C) geriatric ward W3, (D) neurologic rehabilitation ward W4, (E) nutrition ward W5, and (F) individuals not attached to any ward (W6). Each cell represents the mean number of distinct individuals (see Supplementary Text S2) from a given category over the whole hospital (in columns) with whom someone from a category present in the ward (in rows) has a CPI.

