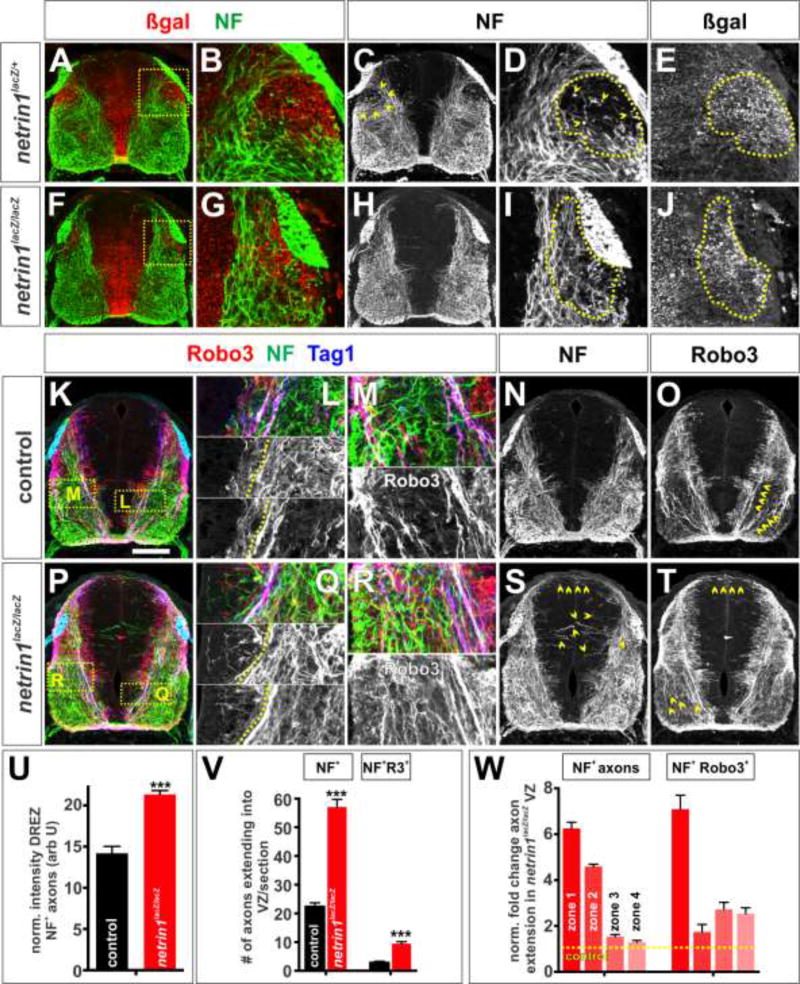
Figure 5. Netrin1 maintains axonal fasciculation and establishes additional boundaries as development proceeds.
(A–T) Brachial (A–J) or thoracic (K–T) level transverse sections of E12.5 netrin1+/+ (K–O), netrin1lacZ/+ (A–E) or netrin1lacZ/lacZ (F-J, P–T) mouse spinal cords labeled with antibodies against NF (green), β-gal (red, A–B, F–G), Robo3 (red, K–M, O–R, T) and Tag1 (blue).
(A–E) In brachial sections, NF+ axons project around the lateral netrin1::β-gal domain below the DREZ (arrowheads, C, dotted lines, D, E). Insets in A and F shown in B, D, E and G, I, J respectively.
(F–J) The sculpting is reduced in netrin1 mutants, with many NF+ axons extending through the putative boundary below the DREZ (dotted lines, I)
(K–O) Control E12.5 NF+ Robo3+ Tag1+ axons continue to observe the VZ boundary (dotted line, L) while the Robo3+ (K, M and O) and Tag1+ (K) axons form two major fascicles, one adjacent to the VZ and the other lateral to it (magnified, M; arrowheads, O). While Robo3+ staining is observed in the DREZ-domain, it appears to label neuronal soma in this region, not axons. However, this staining makes it challenging to assess how the trajectory of Robo3+ axons is affected by the netrin1+ DREZ domain.
(P–T) Netrin1 mutant E12.5 NF+, Tag1+ and Robo3+ axons continue to extend robustly into the VZ (left of the dotted line, Q). The Robo3+ (P, R and T) and Tag1+ (R) fascicles are almost completely defasiculated (magnified, R; arrowheads, T).
(U) Quantification of NF+ intensity levels, normalized for area, in the E12.5 D EZ β-gal zone suggest that there is ~33% increase in axons in the mutants (netrin1lacZ/lacZ, n=131 hemisections from 4 embryos) compared to control (netrin1lacZ/+, n=72 hemisections from 2 embryos) embryos.
(V) Up to 3-fold more NF+ and NF+ Robo3+ axons project into the VZ in E12.5 netrin1 mutant embryos (n=54 sections from 4 embryos) compared to control littermates (n= 29 sections from 3 embryos).
(W) Quantification of fold change in NF+ and NF+ Robo3+axon extension into the netrin1lacZ/lacZVZ along the dorsal-ventral axis. n as for (V).
Probability of similarity between control and mutant, *** p< 0.0005 Student’s t-test.
Scale bar: 145 µm

