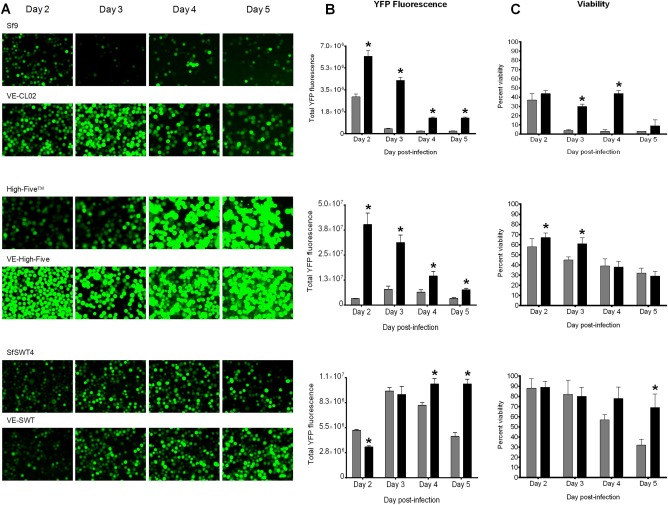
Figure 1.

Vankyrin‐enhanced cells have increased YFP fluorescence and viability compared to their parental cell line.
Legend: (A) Fluorescent images (×200 magnifications), (B) measured YFP fluorescence, and (C) cell viability for VE‐CL02 and its parental cell line Sf9 (top panels; Sf‐900™II medium), VE‐High Five and its parental cell line High‐Five™ (middle panels; Express Five® SFM medium), and VE‐SWT and its parental cell line SfSWT4 (bottom panel; TNM‐FH medium with FBS) infected with a baculovirus encoding YFP (YFP‐AcMNPV) at a multiplicity of infection (MOI) of 5 is shown for days 2–5 post‐infection. All infections were in static cultures with a cell density of 5 × 10⁵ cells at the time of infection. Total YFP fluorescence for each infection (B) was determined by flow cytometry using the Guava easyCyte Flow Cytometer as described in the Materials and Methods section. Percent viability (C) was determined by trypan blue staining as described in the Materials and Methods section. In (B) and (C), parental cell lines are indicated by gray bars, and Vankyrin‐enhanced (VE) cell lines are represented by black bars. The increase in cell viability in virus‐infected VE‐CL02 cells (C, top panel) from day 3 to day 4 can be explained by the difference in total cell number. The data presented are means and standard deviations for triplicate determinations for each cell line in a single experiment. The data presented here are representatives of multiple experiments performed from which equivalent results were obtained. Statistical significance (P ≤ 0.05) as determined by the Student two‐tailed t test for comparison of baculovirus‐infected parental cells vs. baculovirus‐infected VE‐cells is represented by an asterisk (*).
