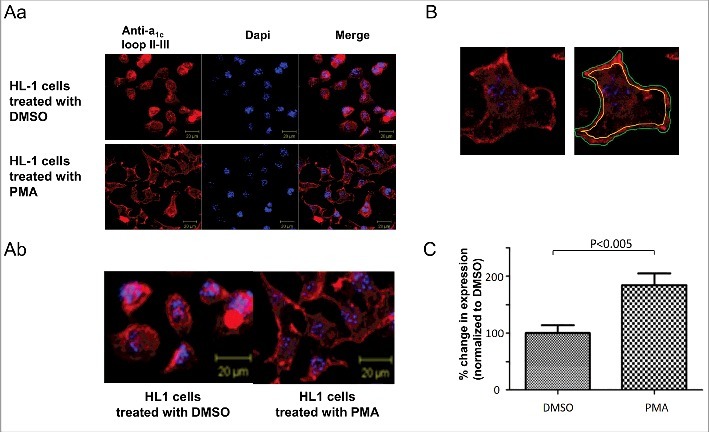
Figure 4.

PKC increases α1C expression PM of HL-1 cells. (A) Hl-1 cells were treated with DMSO (vehicle) or PMA and visualized by staining α1C. Staining was much more confined to PM in PMA-treated cells. The lower panel is a zoom on a selected area from the upper panel images. (B) A representative cell depicting how PM content of α1C was quantified. (C) Quantification of PM content of α1C in DMSO vs. PMA treated HL-1 cells.
