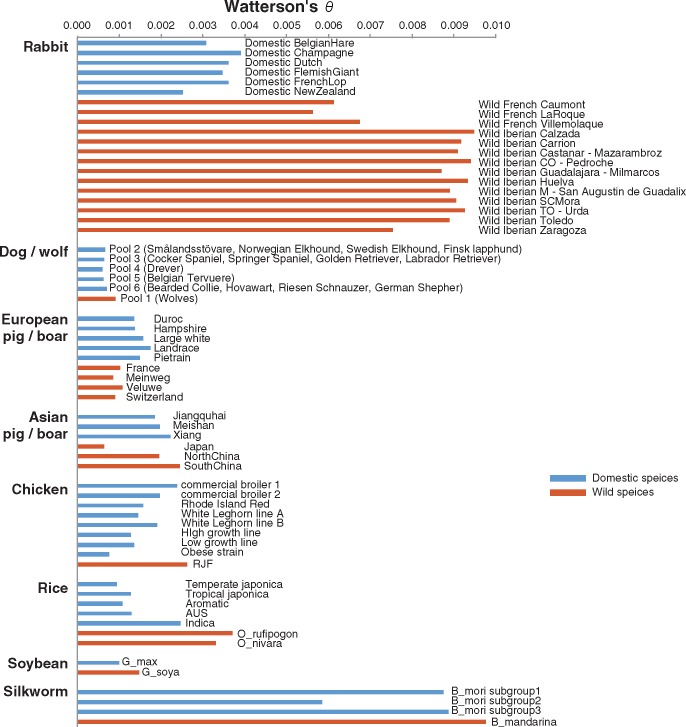
Fig. 1.
—Estimates of Watterson's θ from domestic and wild species. Watterson's θ values for rabbits, dog/wolf, pig/boar chicken, rice, soybean, and silkworm. Blue and red bars indicate Watterson's θ in pooled samples from domestic and wild species, respectively. Samples are grouped into pools based on the format of the original data sets.

