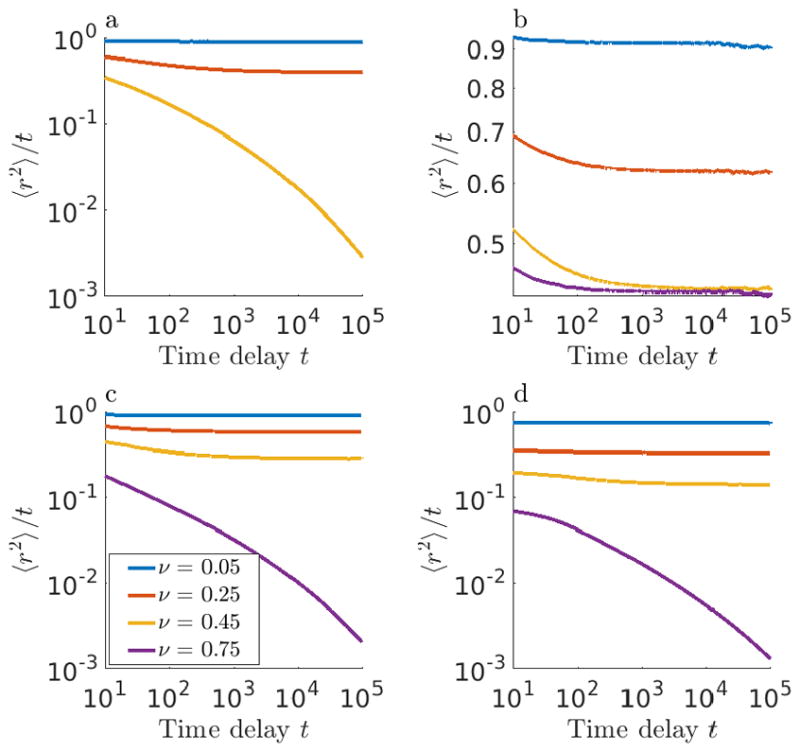
Figure 2.

Mean-squared displacement 〈r2〉 divided by time delay t as a function of time delay t for (a) impenetrable obstacles, (b) repulsive slippery obstacles (ΔG = 2), (c) repulsive sticky obstacles (ΔG = 2), and (d) attractive sticky obstacles (ΔG = −2). Different colors correspond to different filling fraction ν. Curves with non-zero slope indicate anomalous diffusion, and the horizontal asymptote indicates the long-time diffusion coefficient. Each curve represents an average over tracers, independent time windows, and obstacle configurations.
