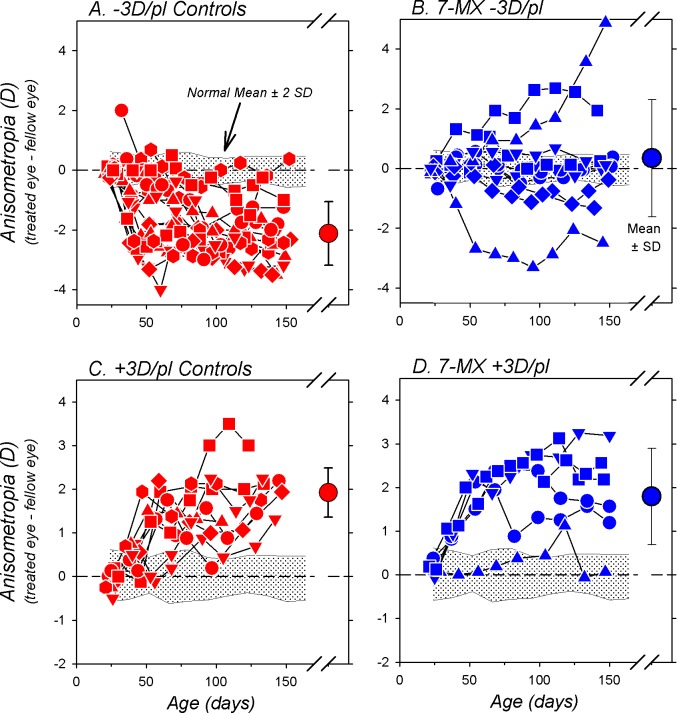
Figure 3.
Interocular differences in refractive error (treated eye–fellow eye) plotted as a function of age for individual animals in the −3D/pl controls (A), the 7-MX −3D/pl group (B), the +3D/pl controls (C), and the 7-MX +3D/pl monkeys (D). The large symbols on the right in each plot show the mean (±1 SD) anisometropia at the end of the lens-rearing period. The shaded area in each plot represents ±2 SDs of the mean anisometropia for the 37 normal control monkeys.

