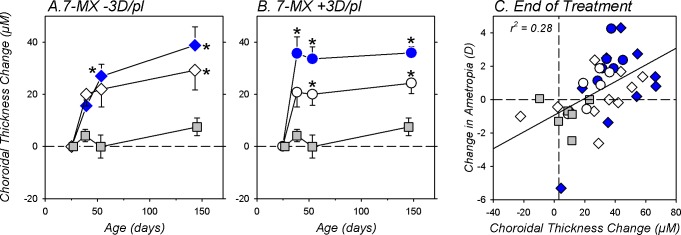
Figure 7.
The average (±SEM) relative changes in choroidal thickness for the treated (blue symbols) and fellow control eyes (open symbols) of 7-MX–treated monkeys reared with −3 D (A) and +3 D of imposed anisometropia (B). The solid gray symbols represent data from untreated normal eyes. The asterisks indicate significant differences (P < 0.05) between the normal and 7-MX monkeys. (C) Changes in ametropia that took place during the lens-rearing period plotted as function of the changes in choroidal thickness for individual animals. The gray squares represent untreated normal eyes. The circles and diamonds symbols represent the 7-MX +3D/pl and 7-MX −3D/pl monkeys, respectively. The treated and fellow eyes of the 7-MX–treated monkeys are represented by the filled and open symbols, respectively. The solid line was determined by linear regression analysis.

