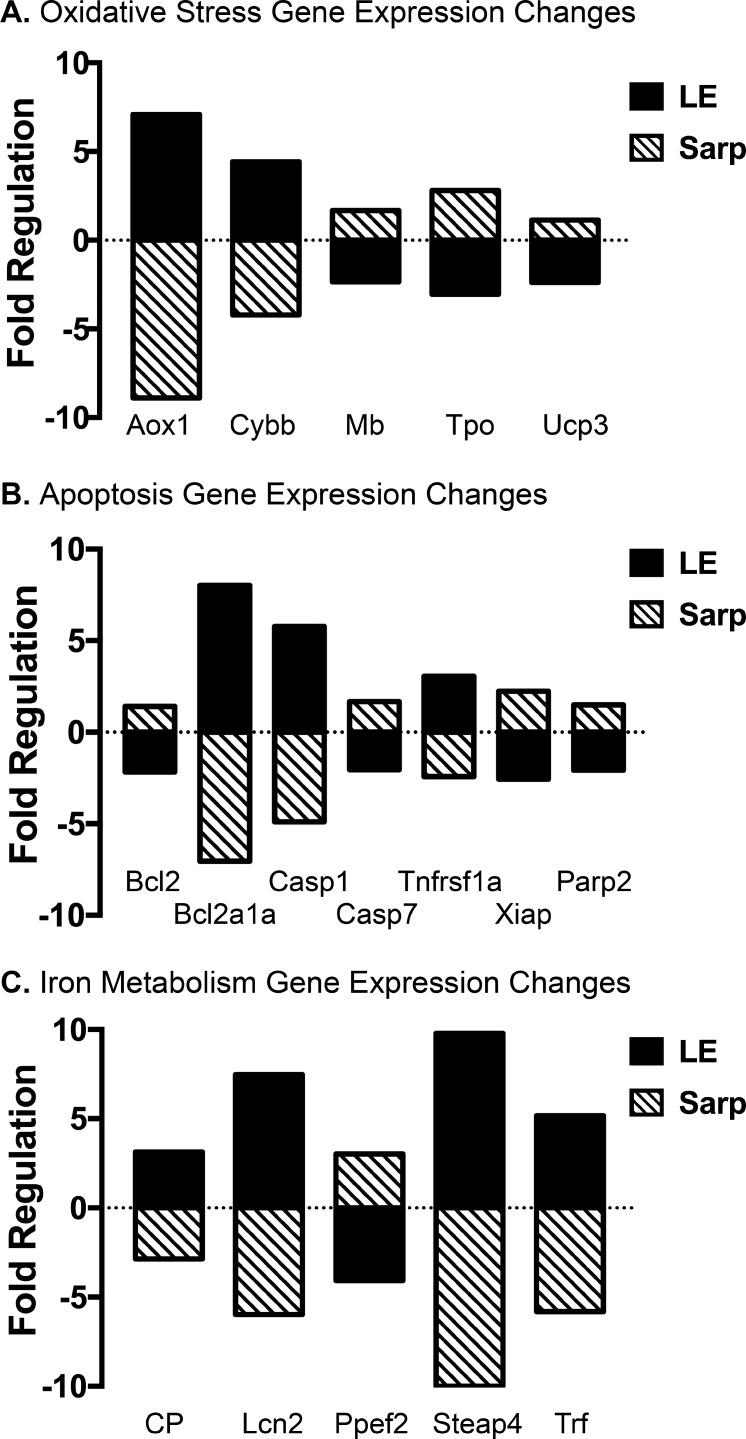
Figure 4.
Sarpogrelate treatment reverses gene expression changes associated with light exposure. Bar graphs reporting retinal oxidative stress (A), apoptosis (B), and iron metabolism (C) gene expression changes caused by light exposure and sarpogrelate treatment. The comparative CT method was used to determine gene expression changes associated with light exposure by comparing data from Vehicle+Saline+No LE and Vehicle+Saline+LE groups (black bar). To determine gene expression changes associated with sarpogrelate treatment, data from the Vehicle+Saline+LE and Vehicle+Sarp+LE groups were compared (striped bar). QIAGEN GeneGlobe data analysis center–calculated fold-regulation changes. Fold regulation greater than 2 represents a biologically significant change in gene expression. n = 6 animals per group. Sarp, 25 mg/kg sarpogrelate; Aox1, aldehyde oxidase 1; Cybb, cytochrome b-245 heavy chain; Mb, myoglobin; Tpo, thyroid peroxidase; Ucp3, mitochondrial uncoupling protein 3; Bcl2a1a, B-cell lymphoma 2–related protein a1; Casp1, caspase 1; Casp7, caspase 7; Tnfrsf1a, tumor necrosis factor receptor superfamily member 1a; Xiap, X-linked inhibitor of apoptosis protein; Parp2, poly [ADP-ribose] polymerase 2; CP, ceruloplasmin; Lcn2, lipocalin-2; Ppef2, protein phosphatase with EF-hand domain 2; Steap4, six-transmembrane epithelial antigen of prostate 4; Trf, transferrin.

