
Fig 1. RA and ITC task design.
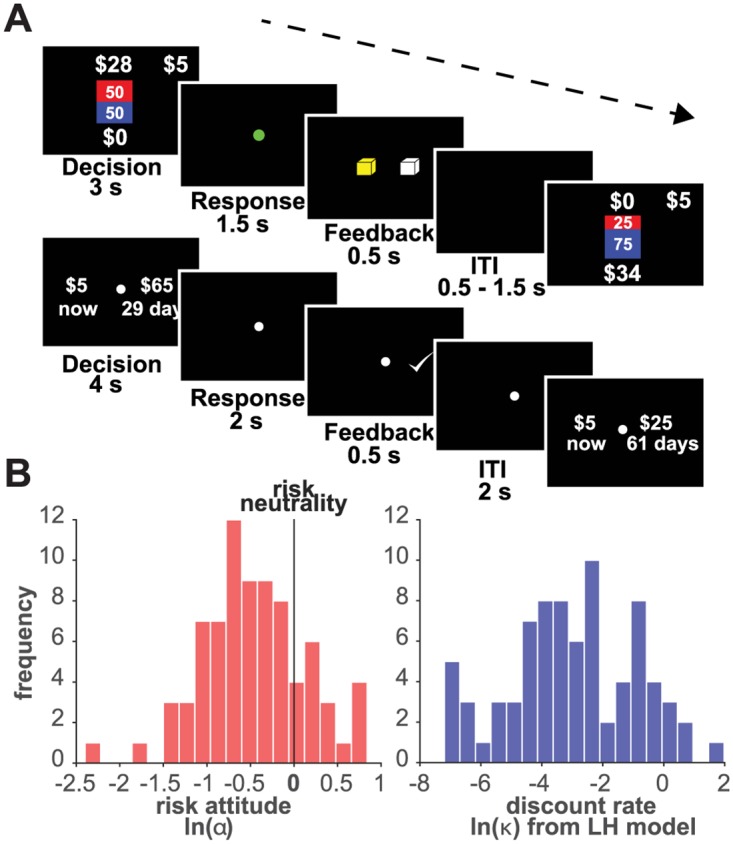
A (top): RA task design, the safe and lottery options are simultaneously displayed during the decision phase. A green dot cues the response time. A yellow square provides feedback on the choice entered. A variable inter-trial interval (ITI) follows. A (bottom): ITC task design, the immediate and delayed options simultaneously displayed during the decision phase. The offer disappears and a white dot cues the response time. A white check mark provides feedback on the choice entered. A variable ITI ensues. For a description of the choice set (see S1A and S1B Fig). B (left): distribution of natural logarithm of risk attitude parameter (ln(α)) across all subjects and all sessions. B (right): distribution of natural logarithm of discount parameter (ln(κ)) estimated from the LH model across all subjects and all sessions.