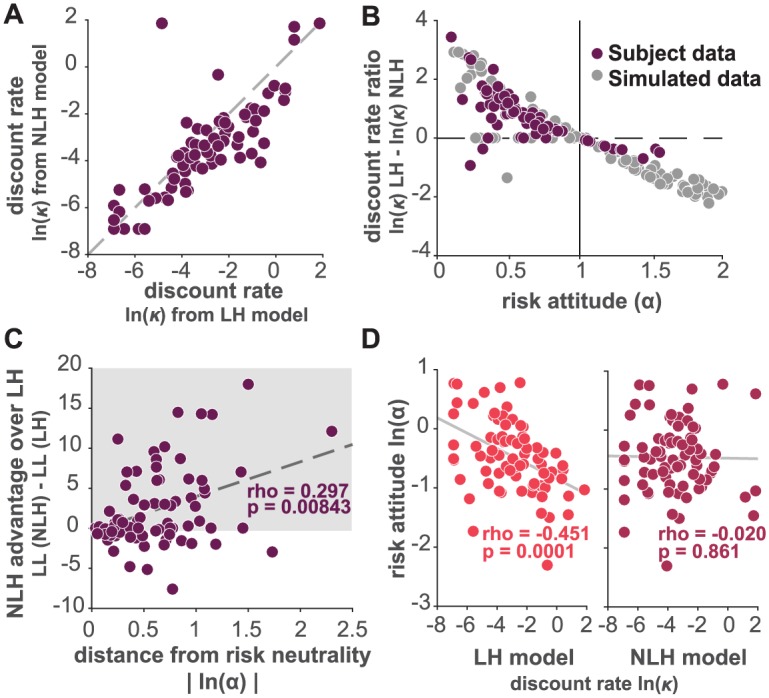
Fig 3. A systematic bias in discount parameters.

A: comparison of estimated discount parameters from model LH against model NLH for each subject’s sessions presented as natural logarithm of discount parameter (ln(κ)). B: discount parameter bias computed as difference between the natural log of estimated parameters from model LH against model NLH (ln(κ)LH − ln(κ)NLH), plotted as a function of the corresponding risk attitude parameter (α), dark dots represent data from each of our subjects’ sessions, gray dots represent simulated data. C: difference of goodness of fit (LL from NLH—LL from LH) between NLH and LH model as a function of the absolute value of the natural logarithm of α (|ln(α)|), risk neutrality here is 0 and any value above 0 is either risk averse or risk seeking. Spearman correlation: rho = 0.297, p < 0.01. Shaded area corresponds to the sessions for which model NLH fit the data better than model LH. D: correlation between the natural logarithm of the risk attitude parameter (ln(α)) and the natural logarithm of the discount parameter and model NLH (dark color).
