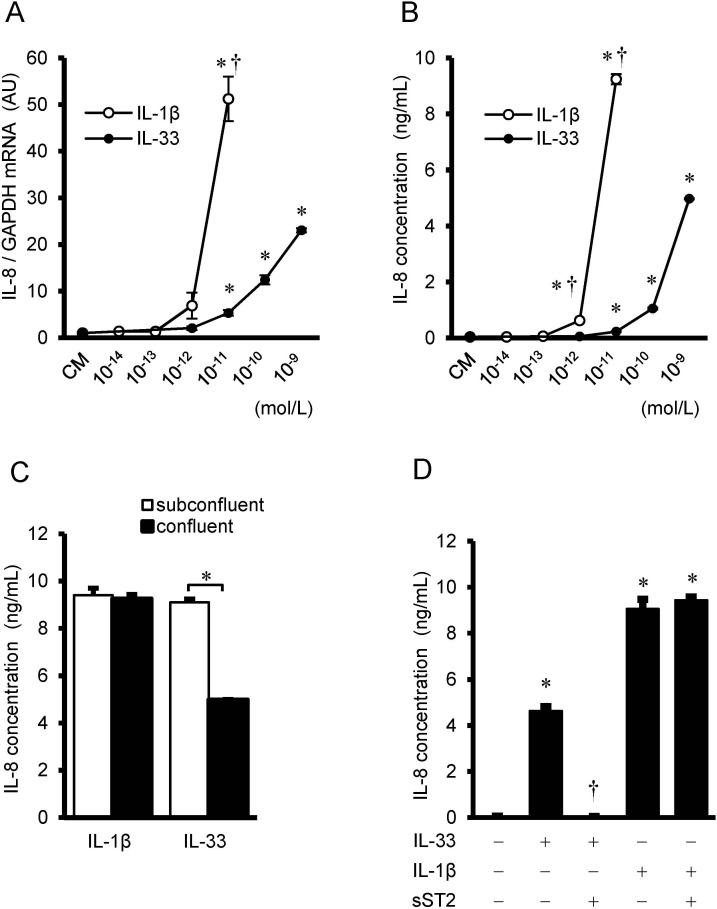
Fig 2. Comparison between IL-33 and IL-1β, and the effects of soluble ST2.
(A) IL-8 mRNA expression in HUVECs after treatment with the indicated concentrations of IL-33 (closed circles) and IL-1β (open circles) for 4 hrs (n = 3), as evaluated by real time RT-PCR. Data represent IL-8 mRNA after normalization to GAPDH mRNA and relative to conditioned medium (CM). *P <0.05 vs. CM, †P <0.05 vs. IL-33 at respective concentrations. (B) IL-8 concentration in the supernatant after treatment with the indicated concentrations of IL-33 and IL-1βfor 24 hrs (n = 3), as analyzed by ELISA. Data represent IL-8 protein secretion per 105 cells. *P <0.05 vs. CM, †P <0.05 vs. IL-33 at respective concentrations. (C) HUVECs were seeded at different densities (subconfluent: confluent = 1:3), cultured, and treated with IL-33 (10−9 mol/L) and IL-1β (10−11 mol/L) for 24 hrs (n = 3). IL-8 concentration per 105 cells was measured by ELISA. *P <0.05 between confluent and subconfluent. (D) HUVECs were pre-incubated with soluble ST2 (sST2, 10−7 mol/L) for 2 hrs, followed by additional incubation with IL-33 (10−9 mol/L) or IL-1β (10−11 mol/L) for 24 hrs. IL-8 concentration per 105 cells was measured by ELISA. *P <0.05 vs. untreated control, †P <0.05 vs. IL-33.

