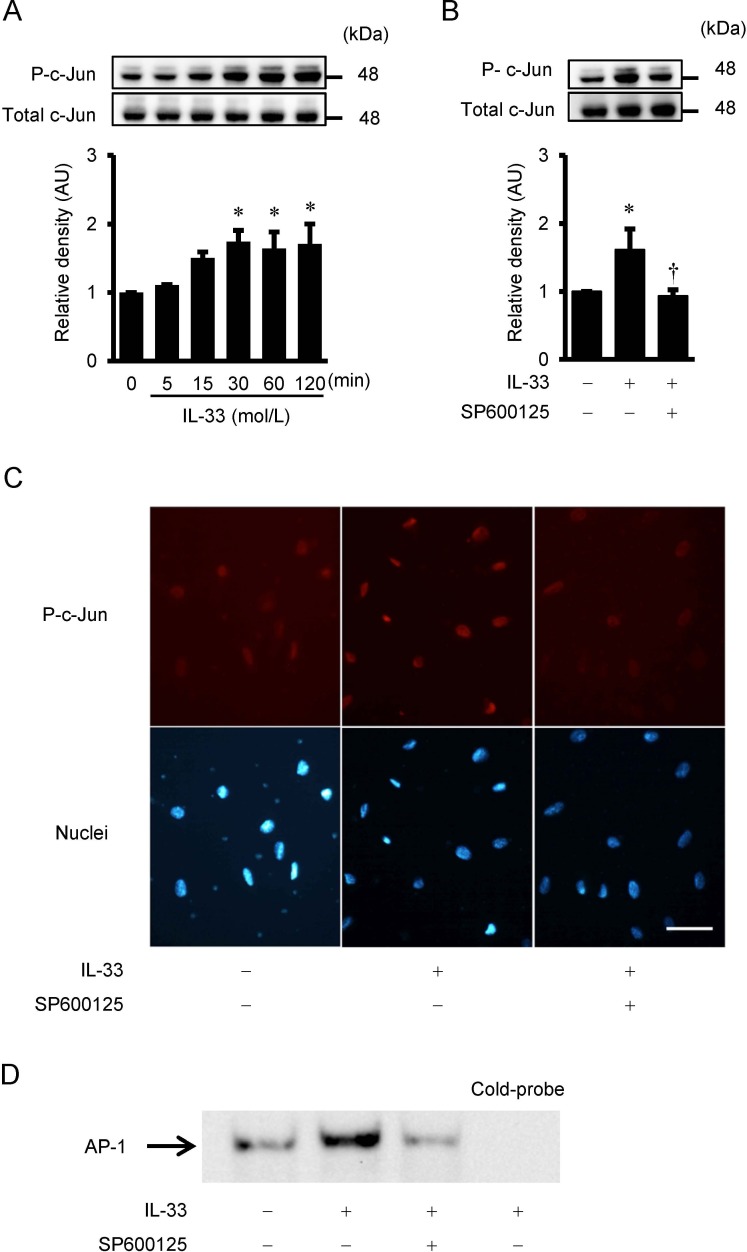
Fig 4. IL-33-induced c-Jun phosphorylation, immunofluorescence staining for phospho-c-Jun, and AP-1 DNA-binding activity.
(A and B) IL-33-induced phosphorylation of c-Jun as evaluated by Western immunoblot analysis. (A) HUVECs were treated with IL-33 (10−9 mol/L) for the indicated time periods. (B) HUVECs were pretreated with SP600125 (30 μmol/L) for 2 hrs, and then incubated with IL-33 (10−9 mol/L) for 60 min. Bars represent results from densitometric analyses of each phosphorylation signal after normalization to total protein and relative to 0 min in A or relative to untreated control in B. Blots are representative of three independent experiments. *P <0.05 vs. 0 min in A or vs. untreated control in B. †P <0.05 vs. IL-33 in B. (C) HUVECs were pre-incubated with SP600125 (30 μmol/L) for 2 hrs and then incubated with IL-33 (10−9 mol/L) for 60 min. Red staining indicates the specific Alexa staining for phospho-c-Jun, and blue staining indicates the nuclei (Hoechst 33342). Original magnification; ×400. Scale bar = 50 μm. (D) IL-33-increased AP-1 binding activity, as measured by electrophoretic mobility shift assay (EMSA). HUVECs were pretreated with SP600125 (30 μmol/L) for 2 hrs and then incubated with IL-33 (10−9 mol/L) for 60 min. Unlabeled probe (cold-probe) was used for competition to verify that the bands were AP-1 specific.

