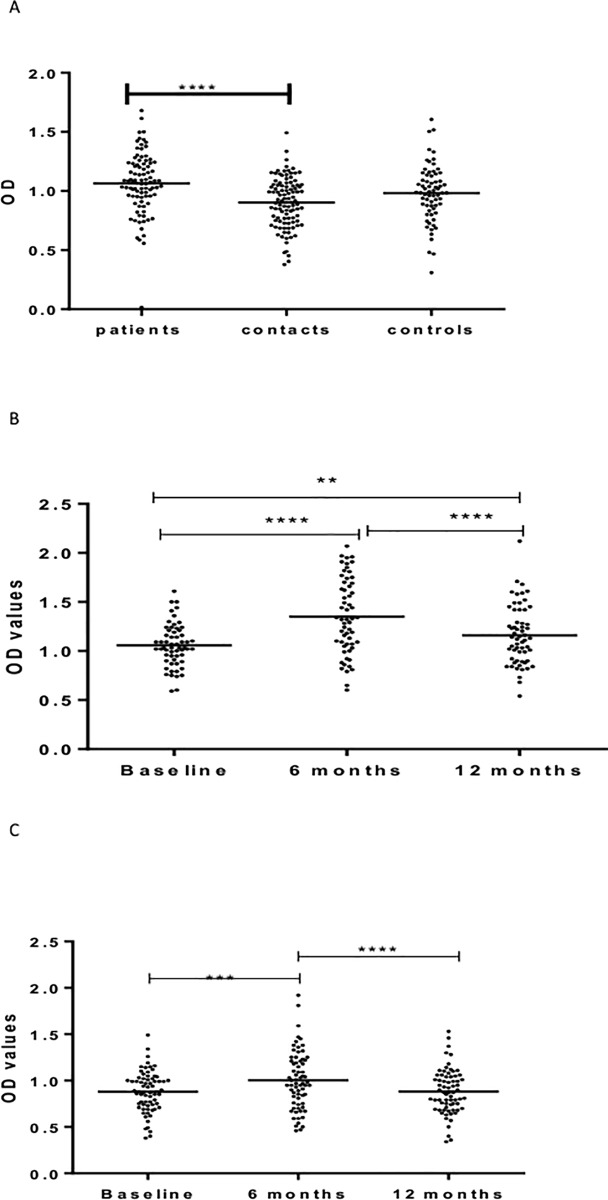
Fig 2.
(a-c). IgA responses to LAM at baseline in the three cohorts (Fig a), 6 and 12 months in patients (Fig b) and HHCs (Fig c). Results are individual responses expressed as OD values. The median for each group is shown as horizontal bar. Kruskal-Wallis and Friedman test with Dunn`s multiple comparisons were used to compare antibody responses among groups and over time, respectively. **p<01*p; ***p<0.001; ****p<0.0001.

