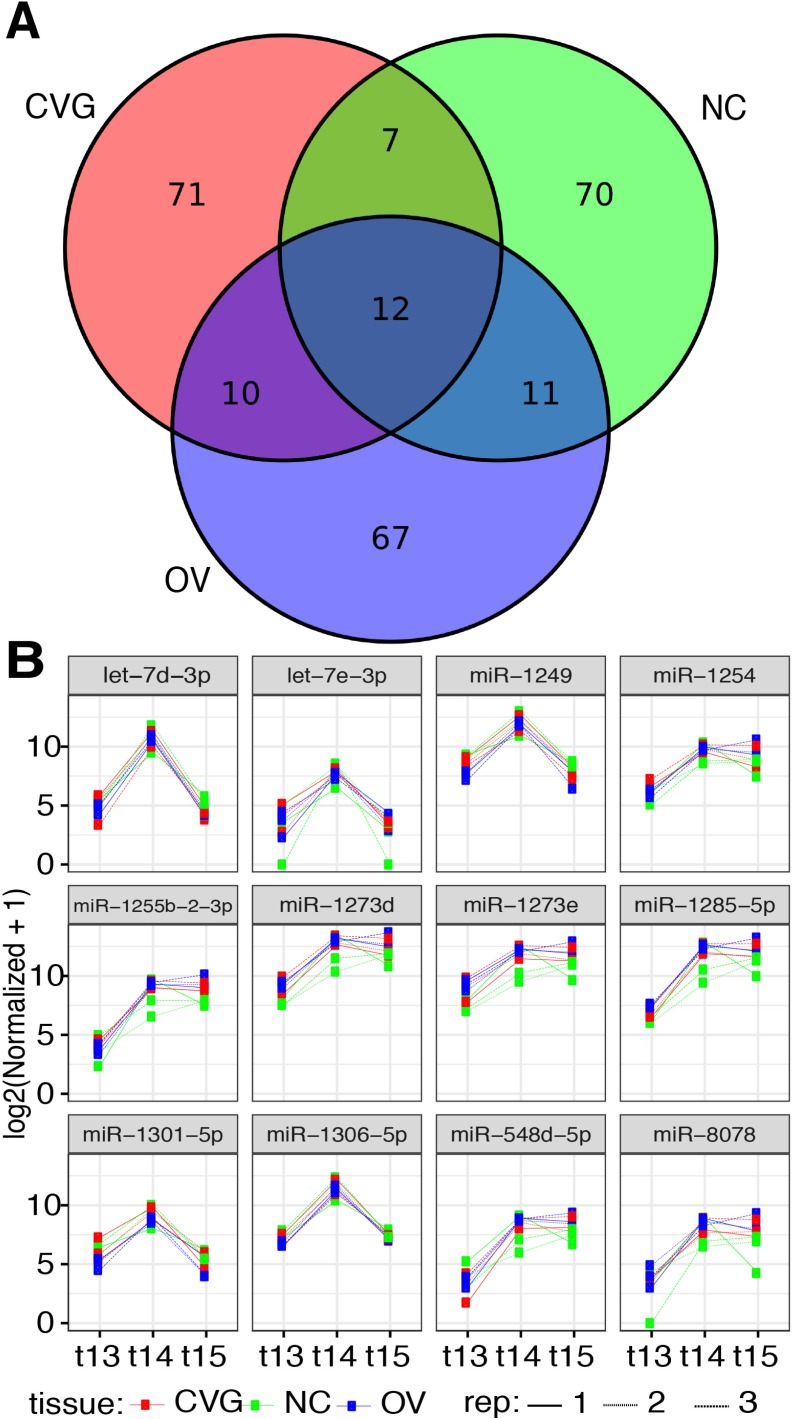
Fig 3. Differentially expressed miRNA across time points.
(A) A Venn diagram is presented showing the top 100 miRNAs differentially expressed among the three time points (stages 13, 14, and 15) for each tissue type (CVG, NC, and OV). (B) Normalized counts are plotted for 12 commonly expressed miRNAs that are differentially expressed across time for all three tissues.

