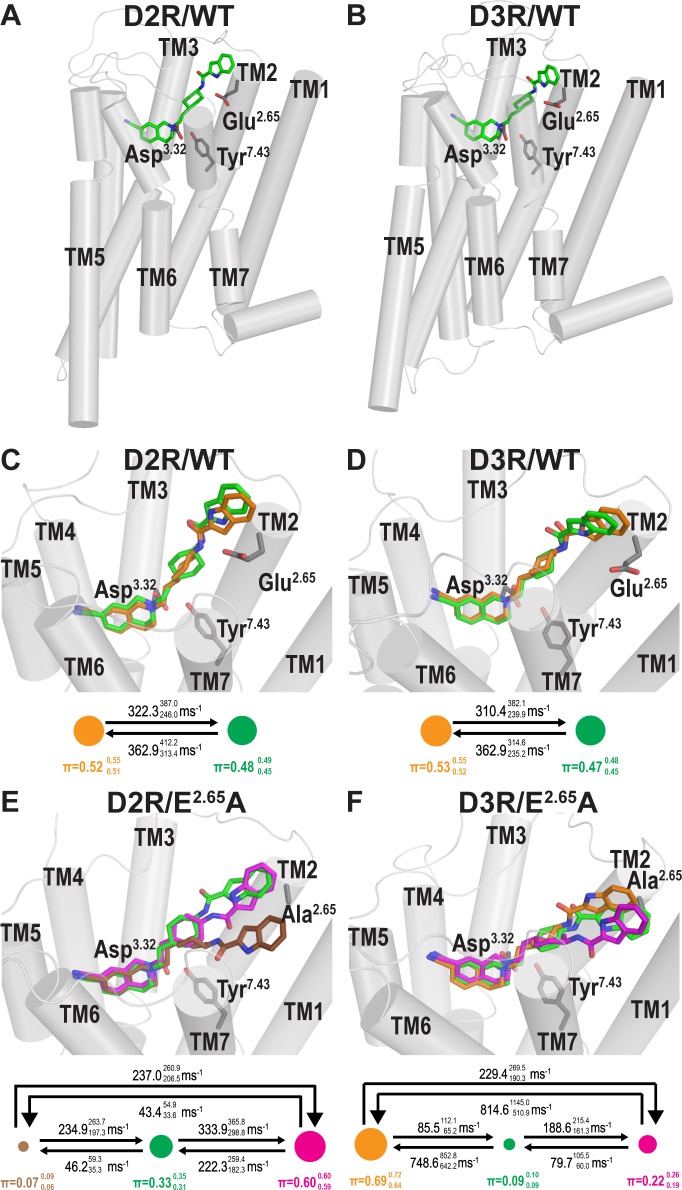
Fig 1. The SP of SB269652 is in dynamic equilibria of binding modes at D2R and D3R.
Panels A and B show the binding modes of SB269652 at D2R/WT and D3R/WT that H-bond with Glu2.65. Panels C and D are zoom-in views of A and B respectively, with additional binding modes of the SP identified by MD simulations and MSM analysis. Our MSM analysis identified two MSs of SP binding (shown in green and orange). The area of each of the spheres representing a MS is proportional to its equilibrium probability (π); the transition rates between the MSs are shown above the arrows connecting them. Panels E and F show the binding modes of SB269652 at mutant D2R/E2.65A and D3R/E2.65A constructs, from the same viewing angles as those in panels C and D. As demonstrated by the results of MSM analysis, the mutation not only disrupts the equilibria of MSs observed in WT (Panel C and D), but also results in distinct binding modes of the SP (brown and magenta MSs for D2R/E2.65A, and magenta MS for D3R/E2.65A). The values from the maximum likelihood Bayesian Markov model and the upper and lower 1σ confidence intervals (in superscript and subscript, respectively) for π and the transition rates from 500 Bayesian Markov model samples are shown. Molecular graphics was generated using PyMOL (version 1.7.6.5, Schrödinger, LLC).

