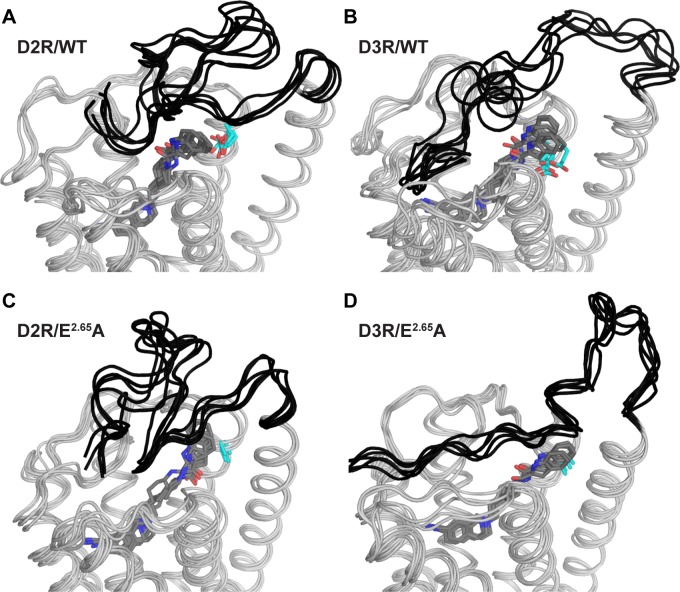
Fig 5. The E2.65A mutation affects the conformational dynamics of the NT.
For each indicated condition, an ensemble of five representative frames of the largest NT cluster for each condition is shown. The N-terminal region is shown in black, and the bound SB269652 is shown as grey sticks (with nitrogen and oxygen atoms colored in blue and red respectively), whereas the residues at the 2.65 position are shown in cyan sticks. Molecular graphics was generated using PyMOL (version 1.7.6.5, Schrödinger, LLC).

