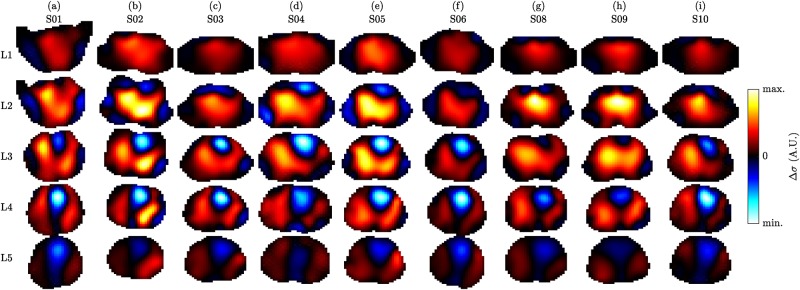
Fig 6. ECG-gated 3D EIT images showing the conductivity difference (end systole vs end diastole) on the five planes L1 (highest) to L5 (lowest) for the nine volunteers (a) to (i), in supine position.
The images of each subject (each column) were scaled to an individual color scale and show the average of the last minute in the first recovery sequence (task T5).

