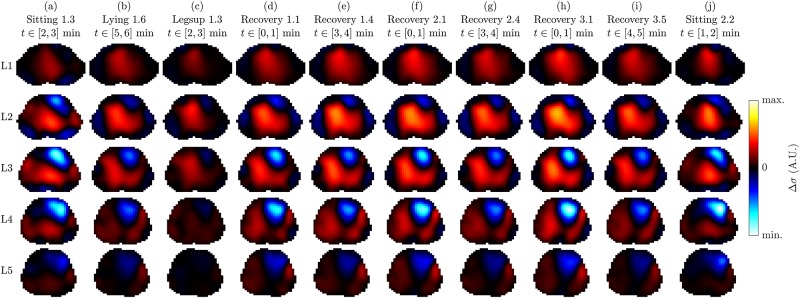
Fig 7. ECG-gated 3D EIT images showing the conductivity difference (end systole vs end diastole) on the five planes L1 (highest) to L5 (lowest) for a selection of ten measurements (a) to (j) of volunteer S05.
All images are shown in a common color scale. Note that the last line in the title below each task name indicates the time range (relative to the start of the corresponding task) over which the one-minute average was performed to obtain one representative cardiac cycle.

