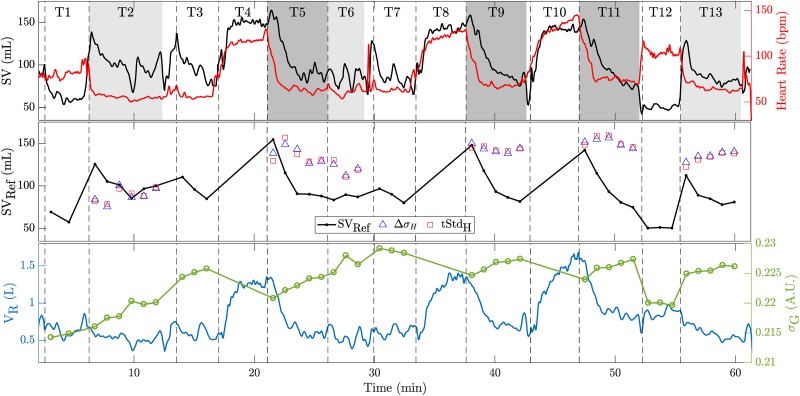
Fig 9.
(Top) Example of temporal evolution of reference stroke volume (black) and heart rate (red) for the entire protocol comprised of tasks T1 to T13 (see Fig 1) for subject S03. The beginning of each task is marked with a dashed vertical line and the particular tasks considered for analysis are shaded in light (lying) or dark gray (recovery). (Middle) One-minute averages used for analysis showing SVRef and two EIT features: the systolic heart amplitude (ΔσH) and the temporal standard-deviation of the heart signal during one full cardiac cycle (tStdH). (Bottom) Tidal volume VR (blue) measured by the reference device (MetaMax 3B) and the one-minute averages of the global conductivity feature σG (green).

