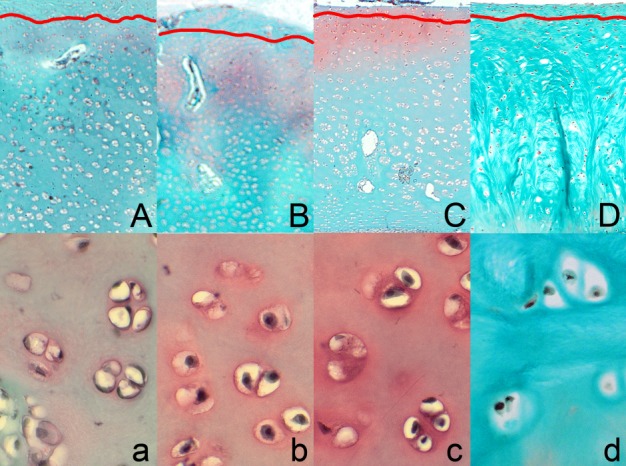
Fig 2. Representative images of safranin O staining carried out on formaldehyde-fixed sections from the tibial articular cartilage of 42-day-old chickens in control groups and supplemented with organic Zn in 25% of recommended dose with or without phytase inclusion.

Vertical section of the zone I and upper part of the zone II of tibial articular cartilage from the NC group fed Zn-deficient diet (A), the Zn25% group (B), the Zn25%+phyt group (C), the PC group fed diet supplemented with ZnO in 100% of daily recommended dose (D). The description of the groups as in Fig 1. The red line shows the end of the zone I and the beginning of the zone II of the articular cartilage. Magnification x200. The cartilage from both control groups displayed very low proteoglycan content, displaying the weakest staining (a, d), while the chickens supplemented with Zn at the dose of 25% of daily demand demonstrated higher but not strong staining linked with higher content of proteoglycans (b). The most intensive staining with safranin O was observed around chondrocytes, especially in group with phytase inclusion (c).
