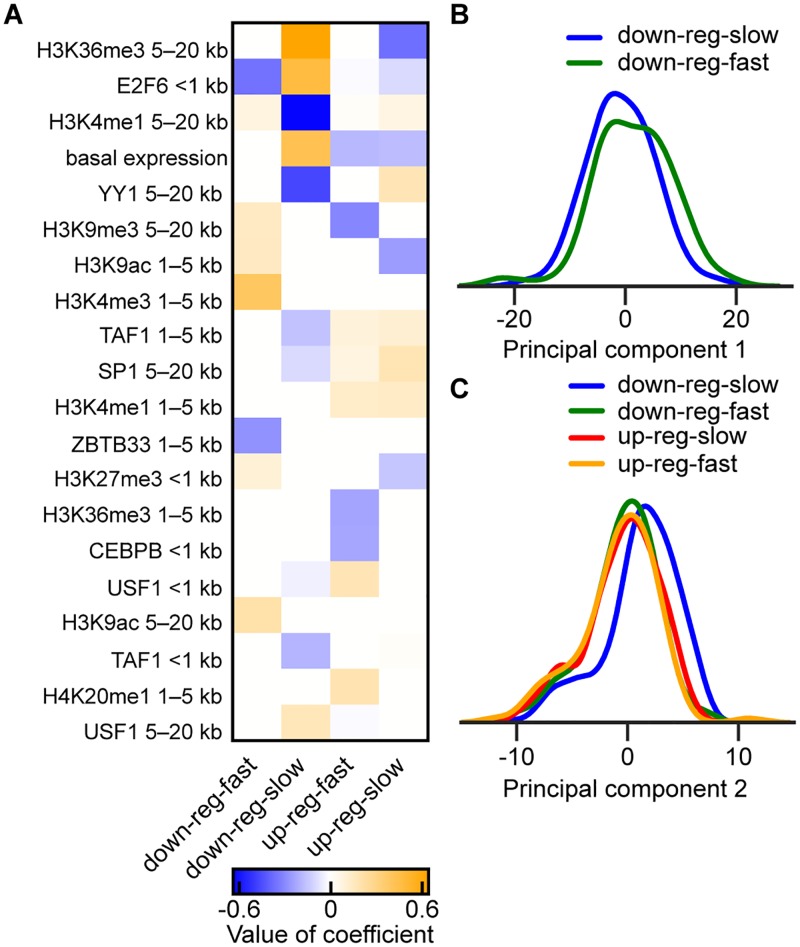
Fig 4. Differences in TF binding and histone modification occupancy in A549 cells in control conditions for the four largest DPGP clusters.
(A) Heatmap shows the elastic net logistic regression coefficients for the top twenty predictors (sorted by sum of absolute value across clusters) of cluster membership for the four largest clusters. Predictors were log10 library size-normalized binned counts of ChIP-seq TF binding and histone modification occupancy in control conditions. Distance indicated in row names represents the bin of the predictor (e.g., <1 kb means within 1 kb of the TSS). An additional 23 predictors with smaller but non-zero coefficients are shown in S6 Fig. (B) Kernel density histogram smoothed with a Gaussian kernel and Scott’s bandwidth [63] of the TF binding and histone modification occupancy log10 library size-normalized binned count matrix in control conditions transformed by the first principal component (PC1) for the two largest down-regulated DPGP clusters. (C) Same as (B), but with matrix transformed by PC2 and with the four largest DPGP clusters.

