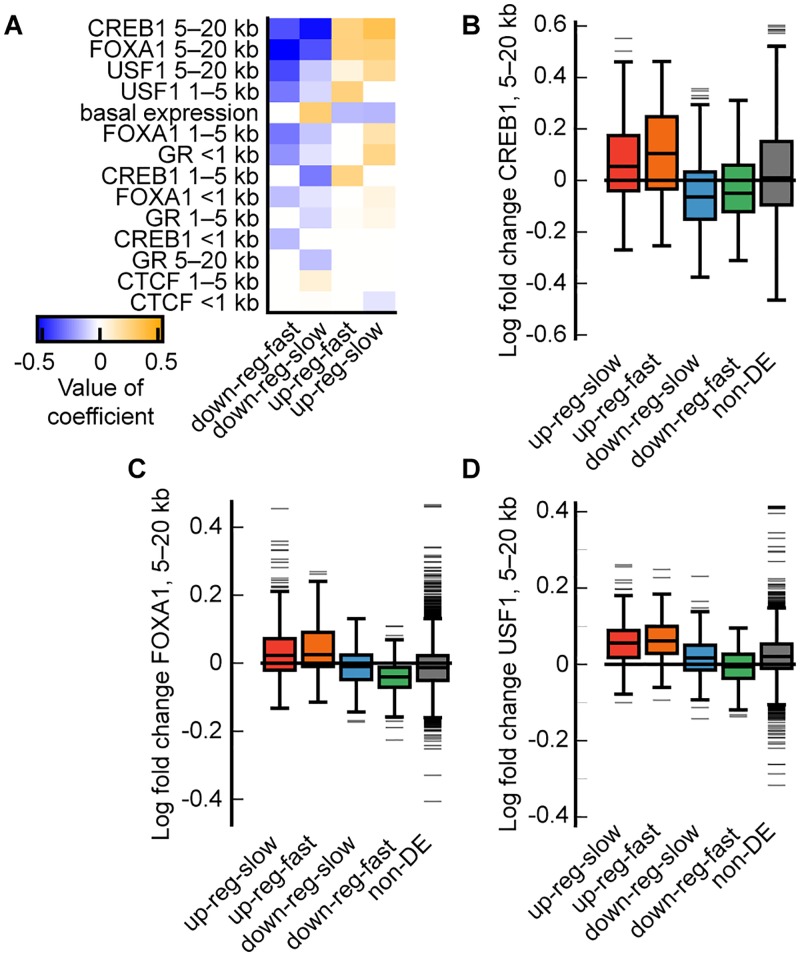
Fig 5. Differences in changes in transcription factor binding in A549 cells in response to glucocorticoid exposure for the four largest DPGP clusters.
(A) Heatmap shows all coefficients (sorted by sum of absolute value across clusters) for predictors with non-zero coefficients as estimated by elastic net logistic regression of cluster membership for the four largest DPGP clusters. Predictors on y-axis represent log fold-change in normalized binned counts of TF binding from ethanol to dex conditions as assayed by ChIP-seq. Distance indicated in row names reflects the bin of the predictor (e.g., 1 kb = within 1 kb of TSS). (B) Boxplots show the logFC in normalized binned counts across clusters and for the group of non-DE transcripts for CREB1, (C) FOXA1, and (D) USF1.

