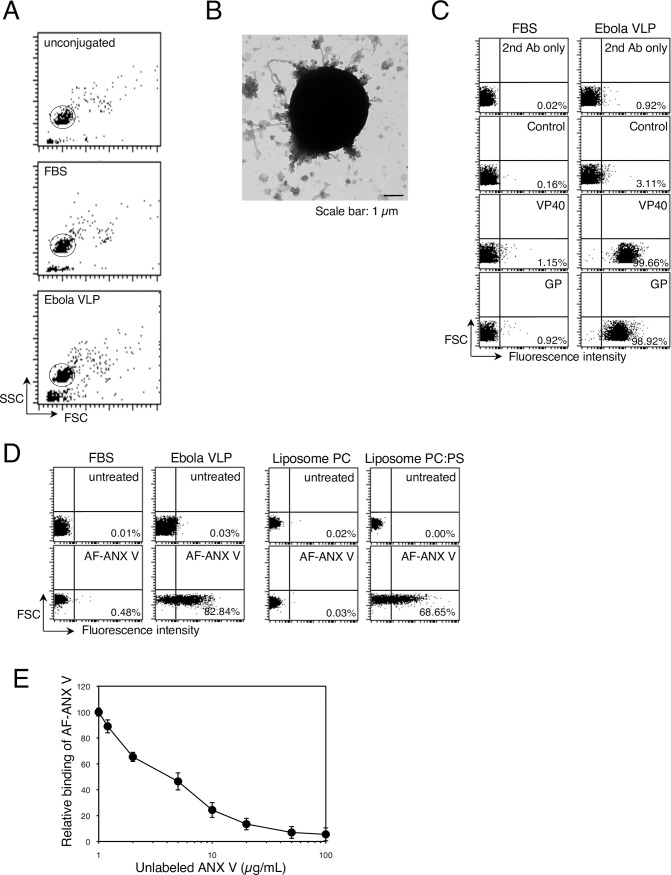
Fig 1. Externalization of PS on the surface of Ebola VLPs.
(A) Representative dot plots of unconjugated (top), FBS- (middle), or Ebola VLP- (bottom) conjugated beads. Purified Ebola VLPs or FBS were incubated with 4-μm latex beads and then analyzed by means of flow cytometry. Single beads (circle) were gated for further analysis. X-axis: forward scatter corner signals, Y-axis: side scatter corner signals. (B) Electron micrograph of Ebola VLP-conjugated beads. Latex beads conjugated with Ebola VLPs were subjected to negative staining. Scale bar: 1 μm. (C) Binding of antibodies to the beads. FBS- (left) or Ebola VLP-conjugated (right) beads were incubated with rabbit polyclonal antibodies against EBOV GP, or VP40, followed by incubation with Alexa Fluor 488-labeled secondary antibody. To analyze the binding of the anti-VP40 antibody, we treated Ebola VLP-conjugated beads with 0.05% Triton X-100 for 10 min at room temperature. Antibody binding to the beads was analyzed by flow cytometry. 2nd Ab indicates beads that were not treated with primary antibody. As a control, the rabbit anti-LASV GPC polyclonal antibody was used. The percentages of the positive populations are indicated. X-axis: fluorescent intensity, Y-axis: forward scatter corner signals showing the size of the gated events. The results are representative of three individual experiments. (D) Binding of fluorescently labeled-ANX V to the beads. FBS- (left) or Ebola VLP-conjugated (right) beads were incubated with or without Alexa Fluor 488 (AF)-ANX V. The percentages of the positive populations are indicated. X-axis: fluorescent intensity, Y-axis: forward scatter corner signals. The results are representative of three individual experiments. (E) The effect of unlabeled ANX V on the binding of AF-ANX V to the beads. Ebola VLP-conjugated beads were pretreated with unlabeled ANX-V at the indicated concentrations. After being washed, the beads were incubated with 1.2 μg/ml AF-ANX V for 15 min at room temperature. Binding of AF-ANX V to the beads was analyzed by flow cytometry. Relative binding of AF-ANX V to the beads is shown. Each experiment was performed in triplicate and the results are presented as the mean ± SD.

