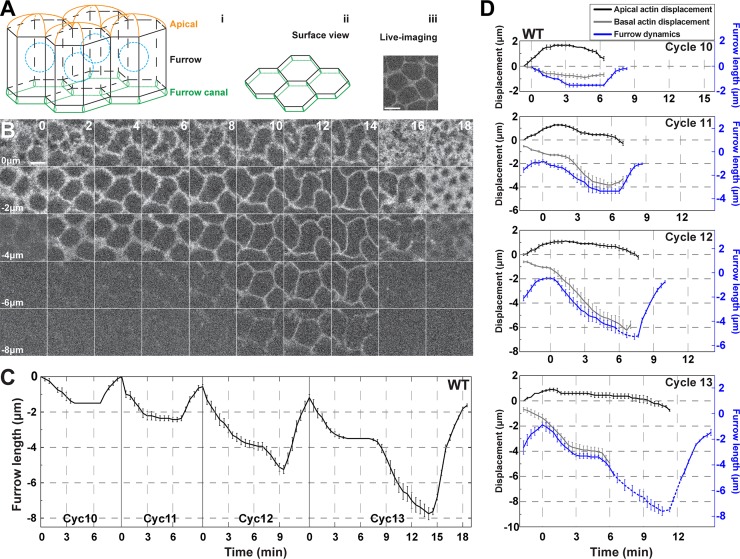
Fig 1. Developmental regulation of furrow dimensions and morphologies in the early Drosophila embryo.
(A) Model of syncytial furrows indicating the apical region, furrow, and furrow canal (i). A planar view of the furrow canal regions is also shown (ii), as well as live-imaging data (iii). Scale bar = 5 μm (B) Still images of furrow dynamics from live-imaged cycle 13 embryos (Gap43:mCh) at t = 0min, 2min, 4min, 6min, 8min, 10min, 12min, 14min, 16min, and 18min, and z-planes at 0, -2, -4, -6, and -8μm. z = 0μm is most apical plane, z = -8μm is most basal. Scale bar = 5 μm (C) Wild type furrow dynamics from cycle 10–13 (cycle 10: n = 4; cycle 11: n = 7; cycle 12 and 13: n = 8). (D) Wild type apical actin displacement (GFP:moeABD, black curve), basal actin displacement (grey curve), and furrow dynamics (Gap43:mCh, blue curve) from cycle 10–13 (n = 4). Dashed blue curves are supplemented from independent data for the out-of-view furrow dynamics. Basal actin displacement curves (grey) end due to actin disbandment at anaphase (cycle 10–12) or to actin moving beyond the field of view (cycle 13).

