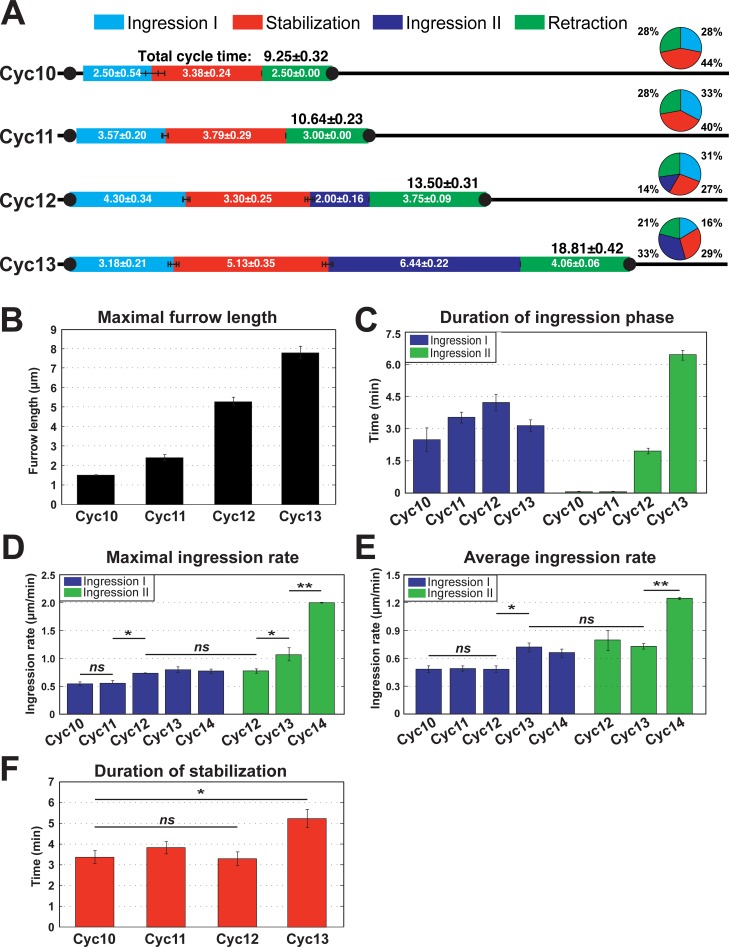
Fig 2. Quantitation of furrow dynamics and ingression rates in WT embryos.
(A) Phases of furrow dynamics from cycle 10–13 in WT. The duration of each phase as well as total cycle times are indicated. The pie chart shows the percentage of duration of each phase for the identified cycle. (B) Maximal furrow length in WT embryos for cycles 10–13 (n≥4). (C) Duration of ingression phase in WT cycles (n≥4). (D) Maximal WT furrow ingression rate (n≥4). *:p<0.05; **: p<0.005; ns: not significant. Maximal rates are calculated from a 2 minute rolling window. (E) Average WT furrow ingression rate during Ingression I or Ingression II (n≥4). *:p<0.05; **: p<0.005; ns: not significant. (F) Duration of stabilization phase in cycle 10–13 (n≥4). *:p<0.05; ns: not significant.

