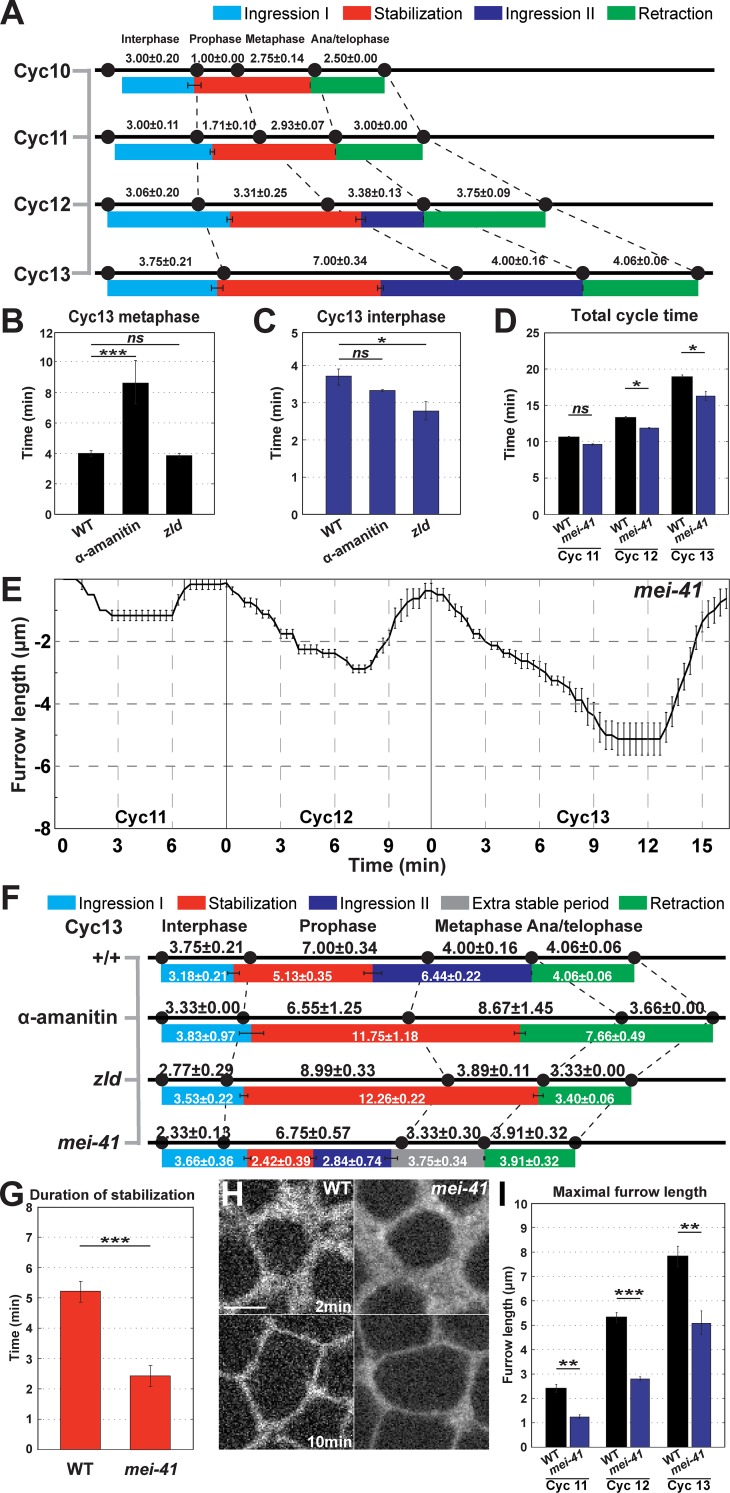
Fig 6. The cell cycle is a permissive cue for furrow dynamics.
(A) Phases of WT furrow dynamics and their correlation to cell cycles during cycles 10–13 (n≥4). (B) Cycle 13 metaphase duration in WT, α-amanitin injected, and zld mutant embryos (n≥4). ***: p<0.0005; ns: not significant. (C) Cycle 13 interphase duration in WT, α-amanitin injected, and zld mutant embryos (n≥4). *:p<0.05; ns: not significant. (D) Total cycle time of WT and mei41 mutant embryos during cycles 11–13 (n≥3). *:p<0.05; ns: not significant. (E) mei41 mutant furrow dynamics (cycle 11:n = 3; cycle 12 and 13: n = 4). (F) Correspondence of furrow phases and the cell cycle in WT, α-amanitin injected, zld, and mei41 mutant embryos during cycle 13 (n≥3). (G) Duration of stabilization phase of WT and mei41 mutant embryos during cycles 11–13 (n≥3). ***: p<0.0005. (H) Furrow morphology in WT and mei41 mutant embryos, at 2 min and 10 min in cycle 13. A region just adjacent to the furrow tips is shown. Scale bar = 5 μm (I) Maximal furrow ingression rate of WT and mei41 mutant embryos during cycles 11–13 (n≥3). **: p<0.005; ***: p<0.0005.

