
FIGURE 2.
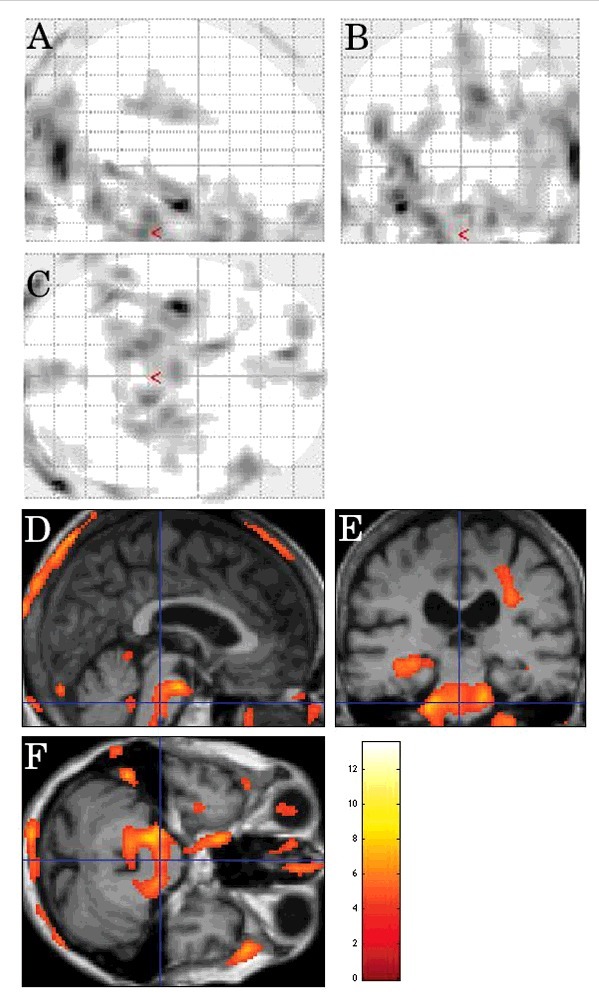
Inter-CJD SPM analysis, using a stringent level of significance of p<0.001 and an extent threshold of 100 voxels, in patients with cerebellar ataxia, showing FDG-PET hypometabolism in the pons, the bilateral (left-predominant) middle cerebellar peduncles, the right frontal subcortical lobe, and the left mesial temporal cortex.