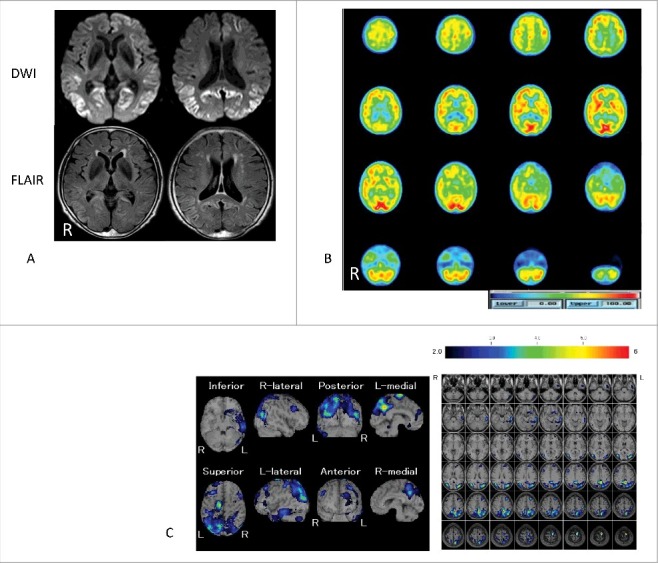
FIGURE 1.

Images of MR and 99mTc-ethyl cysteinate dimer-single photon emission computed tomography (99mTc-ECD-SPECT) 7 months after symptom onset. Panel A: Diffusion-weighted images (DWI) and fluid-attenuated inversion recovery (FLAIR) images of MR; Panels B and C: Plain images and easy Z-score analysis images of 99mTc-ECD-SPECT. In panel A, DWI shows apparent hyper-intensity areas in the bilateral occipital, parietal, and partial left frontal and temporal cortices. Additionally, FLAIR images showed slightly hyper-intense area in these cortices. In panel B, the scale bar from 0 to 100 is indicated by the blue to red (higher regional cerebral blood flow [rCBF]) color gradient. In panel C, easy Z-score analysis images of 99mTc-ECD-SPECT reveal decreased rCBF bilaterally in the parietal lobes with left-sided predominance and partial decreases in the left temporal and frontal lobes. A higher Z-score scale indicates a lower rCBF. The Z-score scale of 2 to 6 is indicated by the black to red (lower rCBF) color gradient.
