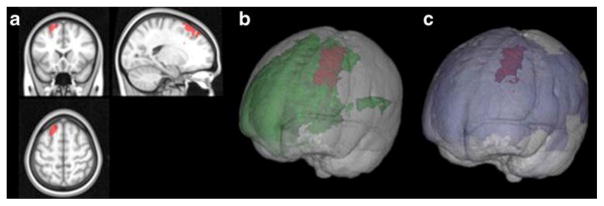
Fig. 2.
a Highlighted brain volume on MNI template in red signifies area of brain where patients’ lesions yielded poorer TMT-B performance. Area was calculated by Brunner-Munzel analysis with 4000 permutations and false discovery rate of 10 % (t-score>2.2). b Power map for volume obtained from VBLSM, green denotes regions with sufficient statistical power, red represents the significant region as shown in (a). c Lesion-overlap map for volume obtained from VBLSM, blue denotes any region where a patient lesion was identified, red represents the significant region as shown in (a) and (b)

