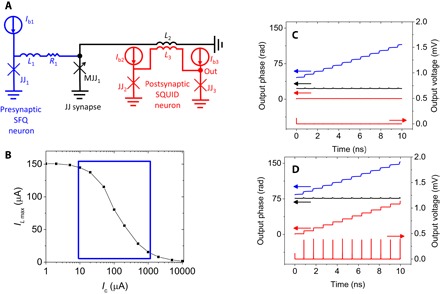
Fig. 3. JJ synapse SPICE simulation.

(A) Circuit diagram used in the simulation, where Ic of JJ1 = JJ2 = JJ3 = 200 μA, L1 = L3 = 3 pH (picohenry), L2 = 5 pH, and R1 = 100 milliohm. (B) Peak current through the coupling inductor L2 versus Ic of the MJJ. Ic values within the blue box are those measured in a single MJJ. (C) Circuit operation with low magnetic order Ic = 100 μA (low synaptic weight) showing the phase modulation of the presynaptic (input) JJ (blue), the JJ synapse (black), the postsynaptic (output) JJ (red), and the output voltage (red right axis). (D) Circuit operation with high magnetic order Ic = 50 μA (high synaptic weight) showing the phase modulation of the presynaptic (input) JJ (blue), the JJ synapse (black), the postsynaptic (output) JJ (red), and the output voltage (red left axis).
