Figure 5.

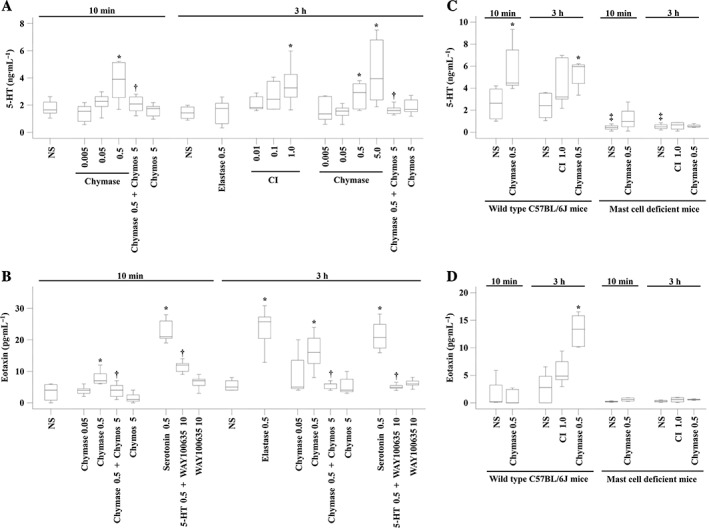
The release of 5‐HT and eotaxin induced by chymase in the peritoneum of mice. (A) Various concentrations of chymase in the presence or absence of chymostatin (Chymos, 5 μg), elastase (μg) or CI A23187 (μM) were injected i.p. 10 min and 3 h before the peritoneal lavage fluids were collected for 5‐HT measurement. (B) Various concentrations of chymase in the presence or absence of chymostatin (Chymos, 5 μg), 5‐HT (μg) in the presence or absence of WAY100635 (μg) or elastase (μg) were injected i.p. 10 min and 3 h before the peritoneal lavage fluids were collected for eotaxin measurement. Chymase (μg) and CI (μM) were injected i.p. in wild‐type C57BL/6J mice and mast cell‐deficient (KitW‐4Bao) mice before peritoneal levels of 5‐HT (C) or eotaxin (D) were determined. NS was employed as a vehicle. Data are displayed as a boxplot, which indicates the median, interquartile range, the largest and smallest values. Each data group represents the results from six to seven animals. *P < 0.05 compared with the corresponding NS group. † P < 0.05 compared with the corresponding stimulus alone group.
