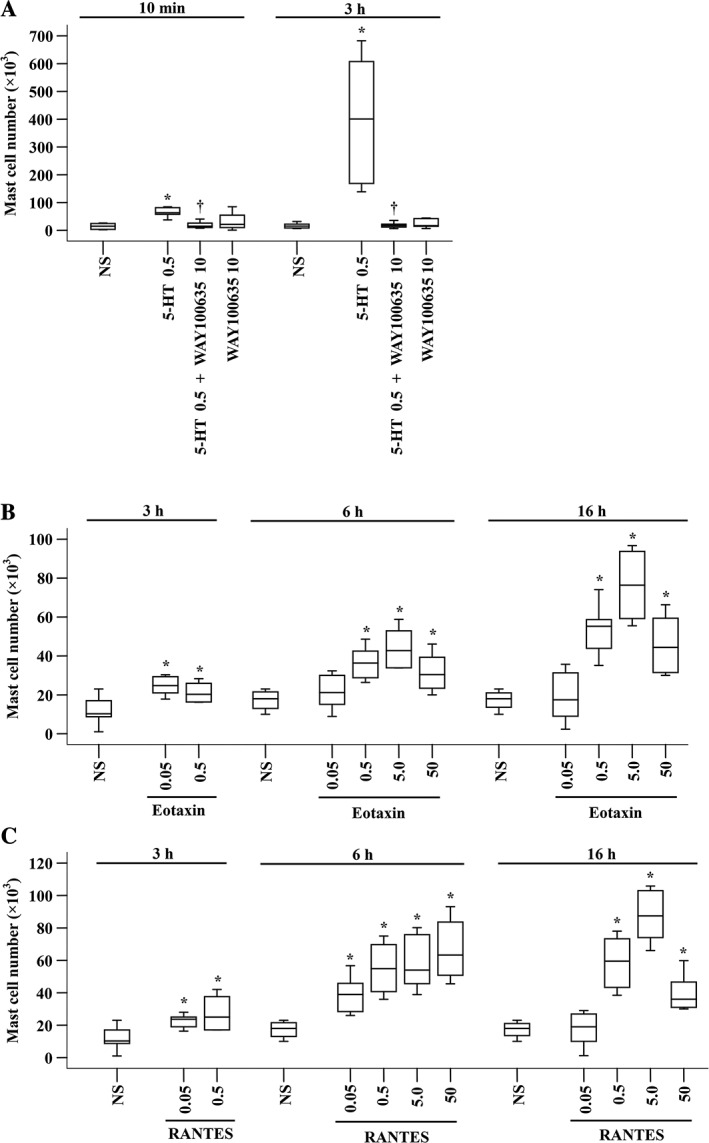
Figure 6.

Mast cell accumulation in the peritoneum of mice induced by 5‐HT and chemokines. (A) 5‐HT (μg) in the presence or absence of WAY100635 (μg) was injected i.p. for 10 min or 3 h. (B) Various concentrations of eotaxin (ng) or (C) RANTES (ng) were injected i.p. for 3, 6 and 16 h. NS was employed as a vehicle. Data are displayed as a boxplot, which indicates the median, interquartile range, the largest and smallest values. Each group of data represents results from six to seven animals. *P < 0.05 compared with the corresponding NS group. † P < 0.05 compared with the corresponding stimulus alone group.
