
Figure 2.
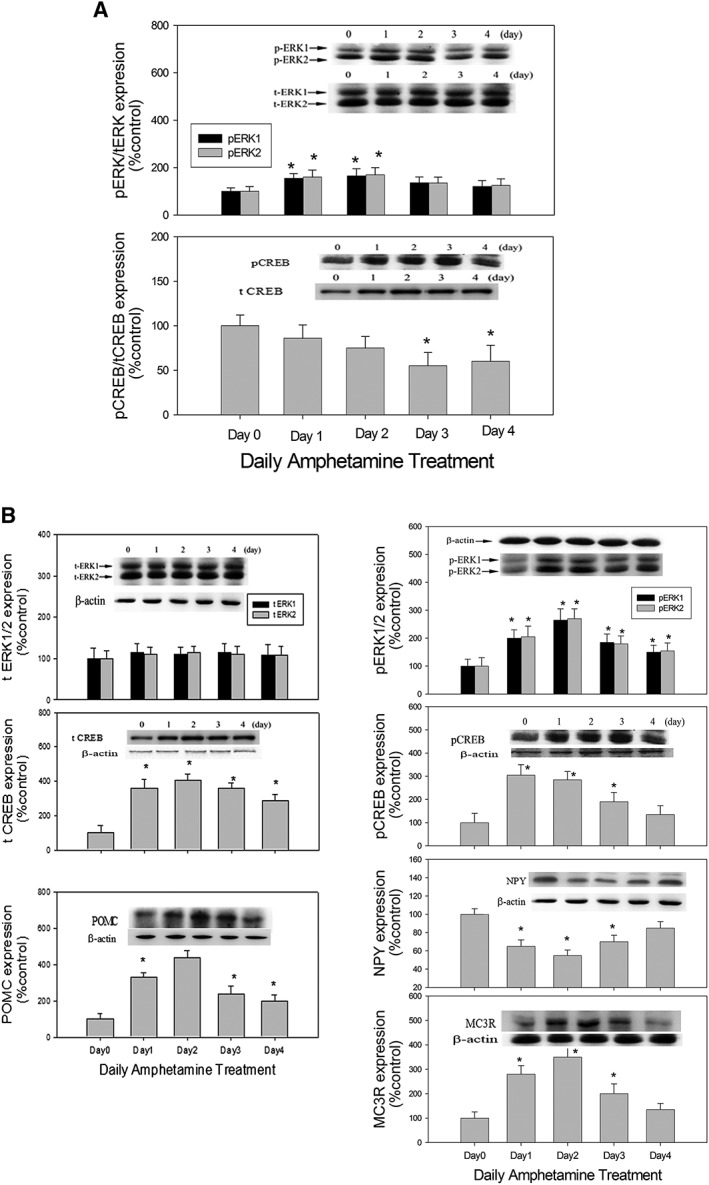
The effect of daily amphetamine (2 mg·kg−1; i.p.) on the ratios of (A) hypothalamic pERK/tERK and pCREB/tCREB expression (upper panel), and on (B) NPY, POMC, pERK1/2, pCREB and MC3 receptor (MC3R) (lower panel) expression over a 4 day period. Inserted images showed the results of Western blots, and the columns represent their relative densitometric values. Contents of protein in AMPH‐treated groups were indicated as the percentage of the control group. Bars are the means ± SEM; n = 8 for each daily treatment group (from Day 0 to Day 4; total of five day‐dependent groups). *P < 0.05 versus control.