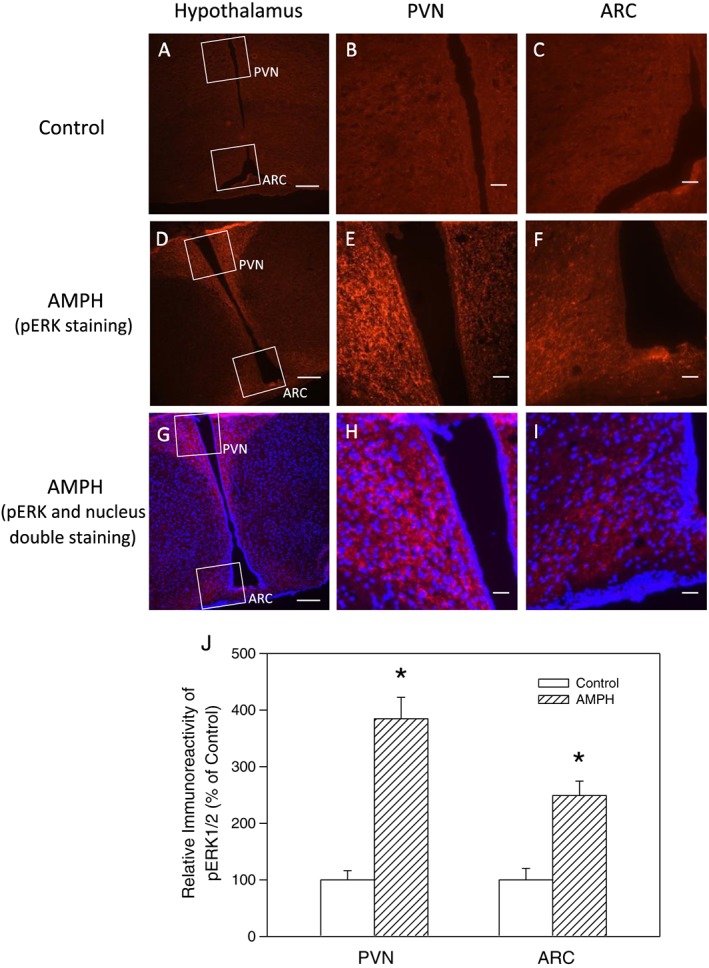
Figure 6.

Immunofluorescent staining of pERK1/2 in hypothalamic ARC and PVN regions in rats receiving saline or amphetamine (AMPH; 4 mg·kg−1; i.p.) treatment. Frontal sections through the median eminence level were obtained. Upper panel: photo images of (A–C) show sections in control group, photo images of (D–F) show pERK fluorescence in AMPH‐treated group and photo images of (G–I) show pERK (red) and nucleus (blue) fluorescence of double staining in AMPH‐treated group. Scale bars in images of (A, D and G) are 100 μm (100×), whereas those in (B, C, E, F, H and I) are 20 μm (400×). Lower panel: results of relative densitometric values (n = 5 for each group; total of three groups) for pERK fluorescence intensity in PVN and ARC regions compared to the control group in AMPH‐treated rat. Each value represents mean ± SEM. *P < 0.05 versus control (t‐test).
