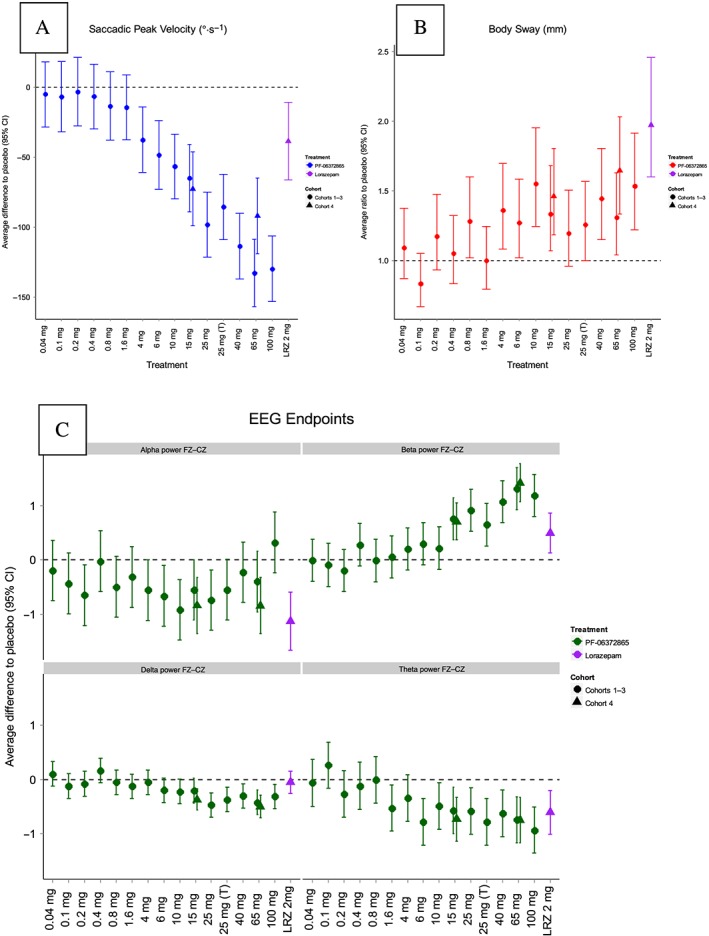
Figure 8.

Plot of difference to placebo in overall LSmeans for (A) SPV, (B) body sway and (C) qEEG frequency band by dose (SAD study). LSmeans represent the average treatment effect versus placebo across the first 6 h post‐dose along with 95% CIs. Error bars that do not intersect the horizontal dashed line indicate a statistically significant effect versus placebo (P < 0.05). Shape represents the cohort, and colour represents the treatment. LRZ, lorazepam; (T), tablet.
