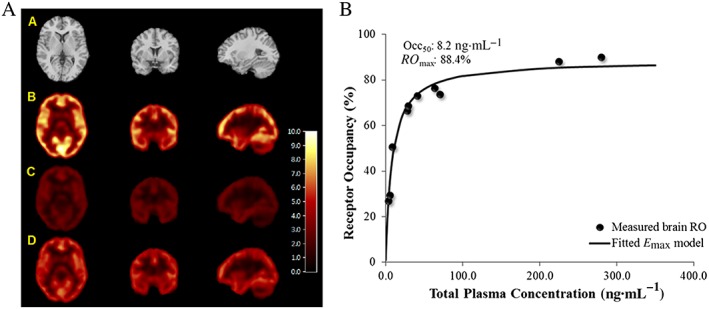
Figure 9.

(A) Representative PET and MRI images in healthy human subjects. (A) MRI, (B) baseline PET, (C) first post‐drug PET at 1.5 h (~66% RO) and (D) second post‐drug PET at 24 h (~27% RO). All images were from the same subject who was dosed with 10 mg of PF‐06372865. Images are displayed along three orthogonal views (coronal, transverse and sagittal views from left to right columns). PET images are in V T units (mL blood.cm‐3 tissue). (B) PET RO versus plasma PF‐06372865 concentration relationship in human subjects. The individual dots are the brain GABAA RO measured, while the line is the fitted relationship with an E max model.
