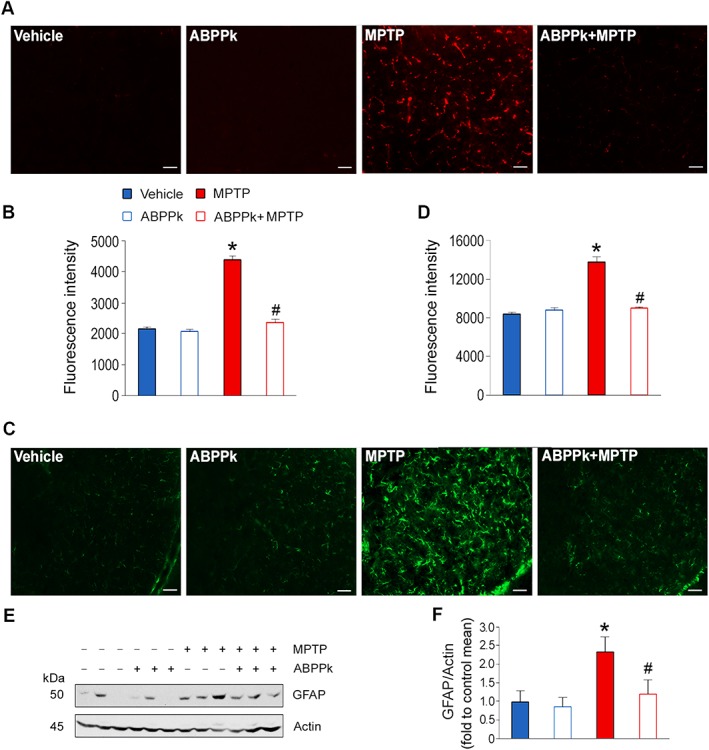
Figure 8.

ABPPk attenuates microglia and astrocyte activation. (A) Immunostaining analysis of CD68 in the SNpc. (B) Quantification of the fluorescence intensity as shown in (A). (C) Immunostaining analysis of GFAP in the SNpc. (D) Quantification of the fluorescence intensity as shown in (C). (E) Western blot analysis of GFAP in the midbrain. Actin was used as a loading control. (F) Quantification of GFAP levels as illustrated in (E). Error bars are ± SEM. *P < 0.05 versus the vehicle treated mice; #P < 0.05 versus the mice treated with MPTP alone. Scale bar = 50 μm. n = 5 for each group.
