
Figure 1.
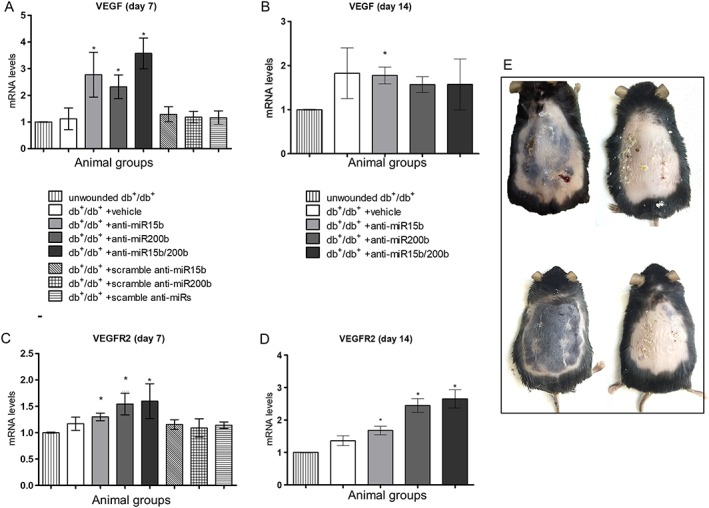
Expression of the mRNA for VEGF and VEGFR‐2 in skin tissue, quantified by RT‐qPCR at both 7 (A, C) and 14 days (B, D) after surgical procedures. Each bar represents the mean ± SD of five animals. *P < 0.05, significantly different from db+/db+ + vehicle. Panel (E) represents the appearance of wounds at day 14 after removal of the stitches and before excision. Examples (from top left clockwise) are of db+/db+ + vehicle, db+/db+ + anti‐miR15b, db+/db+ + anti‐miR200b and db+/db+ + anti‐miR15b/200b mice.