
Figure 4.
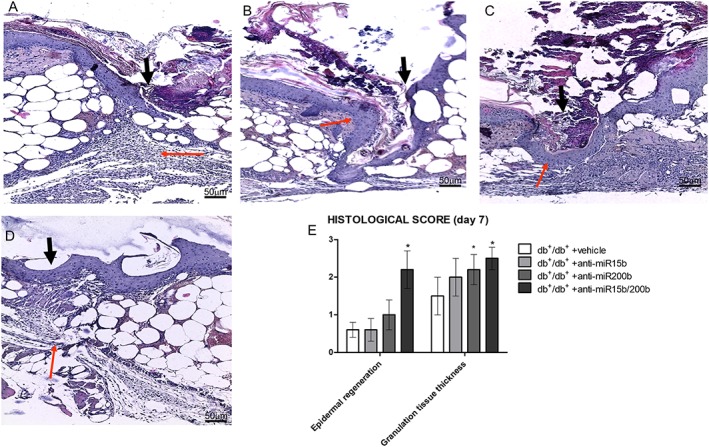
Haematoxylin‐eosin staining of peri‐lesional skin tissue from diabetic animals treated with vehicle (A), anti‐miR15b (B), anti‐miR200b (C) and anti‐miR15b/200b (D), 7 days after surgical procedures. Black arrows point at the incision site, and red arrows point at granulation tissue. The graph represents the cumulative histological score for each group. Each bar represents the mean ± SD of five animals. *P < 0.05, significantly different from db+/db+ + vehicle.