
Figure 5.
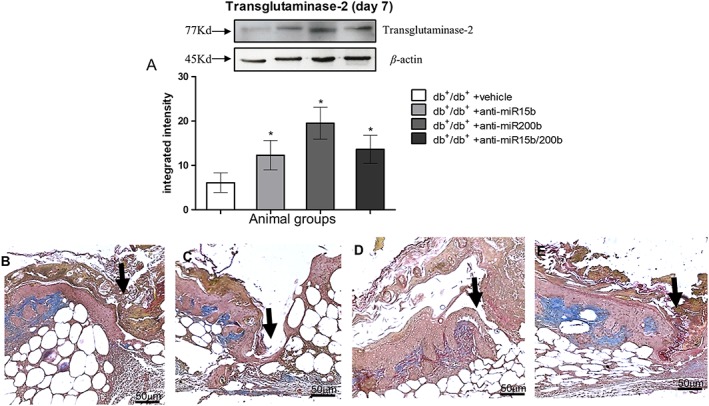
Transglutaminase‐2 protein (A) quantification by Western blot from skin tissue at day 7 following wounding. Each bar represents the mean ± SD of five animals. *P < 0.05, significantly different from db+/db+ + vehicle. Masson's trichrome stain (B–E) was used to highlight sub‐epithelial connective tissue restoration, (B) db+/db+ + vehicle; (C) db+/db+ + anti‐miR15b; (D) db+/db+ + anti‐miR200b; (E) db+/db+ + anti‐miR15b/200b. Black arrows point at the incision site, blue colour stains collagen tissue with elastin (red stained fibres close to collagen).