
Figure 7.
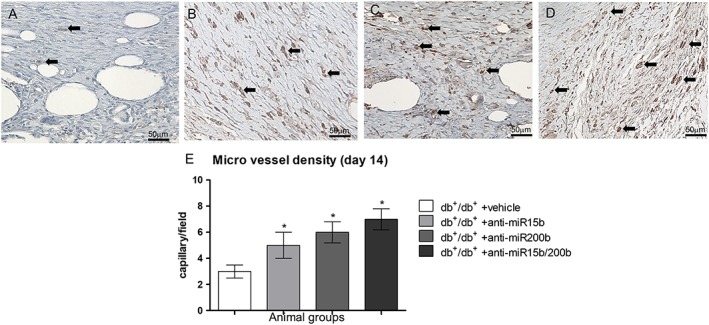
CD31 immunostaining (A–D) of wounded skin obtained at day 14; microphotographs are representative of diabetic animals treated with vehicle (A), anti‐miR15b (B), anti‐miR200b (C) and anti‐miR15b/200b (D). The graph (E) represents the count of small vessels with visible lumen. Each bar represents the mean ± SD of five animals. *P < 0.05, significantly different from db+/db+ + vehicle.