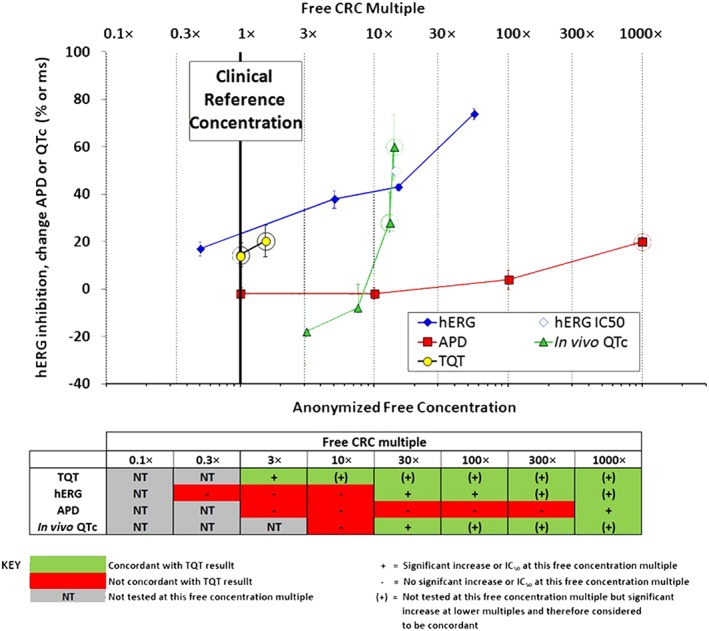
Figure 1.

Example of the format for evaluating assay performance. Upper panel: for each drug, concentration–response data from the non‐clinical assays and clinical TQT study were plotted as means ± SEM (non‐clinical data) or confidence intervals (clinical data). The CRC (bold vertical line) was defined from the TQT study as either the highest free (unbound) maximum drug concentration (Cmax,free) tested for TQT‐negative drugs or the lowest Cmax,free showing QT prolongation for TQT‐positive drugs. The CRC was set as the 1× multiple upon which all comparisons were made. Dotted vertical lines indicate multiples from the CRC. Rings around non‐clinical data results indicate concentration multiples at which positive effects occurred. Rings around TQT study results indicate TQT‐positive findings as defined by the FDA IRT. Lower panel: concordance was evaluated by comparing positive or negative results in non‐clinical studies with the TQT study outcome based on free CRC multiples. The green colour code in the table signifies concordance with TQT study results, red indicates discordance and grey (NT) indicates concentrations below the CRC that were not tested.
