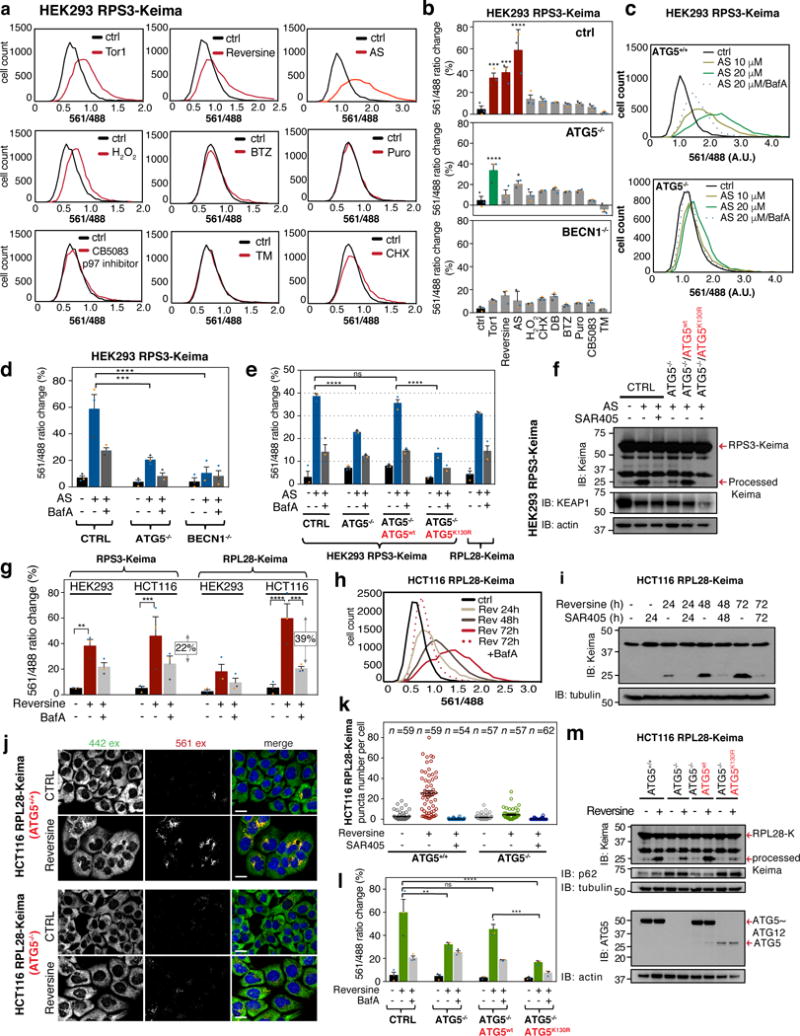
Figure 2. mTOR inhibition promotes ribophagy flux in a VPS34-dependent manner.

(a) Ribo-Keima reporter cells were treated with BafA (50 nM, 1h), Torin1 (150 nM, 24h), or combination of the two, then analyzed by flow-cytometry. Frequency distributions of 561/488 nm excitation ratios are shown (n = 10,000 cells per condition). (b) The mean value of the biological triplicate experiments for 561/488 nm excitation ratios (from panel b) is shown in the histogram. Error bars represent S.E.M. (****p <0.0001, **p <0.01, *p <0.04, Two-way ANOVA). (c) Ribo-Keima reporter cell lines treated with Torin1 (150 nM, 24h), SAR405 (an inhibitor of VPS34, 1 μM, 24h), or combination of the two were immunoblotted for Keima and LC3B. (For asterisk, see Supplemental Fig. 1d) (d) Confocal images of live HEK293 cells expressing RPS3-Keima after Torin1 (150 nM, 24h) or Torin1 (150 nM, 24h)/SAR405 (1 μM, 24h) co-treatment. (Scale bar = 20 μm) (e) Unbiased quantitation of the live-cell images in panel d for number of red Keima puncta per cell are shown. Mean ± S.E.M. (n=52, 60, 60 cells from three independent experiments) (f) HEK293 RPS3-Keima cells stably expressing LAMP1-eGFP were incubated in the presence or absence of Torin1 for 24h prior to live-cell imaging. (Scale bar = 20 μm) (g) HEK293 RPS3-Keima cells treated as in (f) were stained with LysoTracker Green prior to live-cell fluorescence microscopy. (Scale bar = 20 μm) (h) HEK293 RPS3-Keima cells stably expressing eGFP-LC3 were treated as in (f), then subjected to live-cell fluorescence microscopy. (Scale bar = 20 μm) For panels f-h, co-occurrence (%) of red Keima puncta with LAMP1-eGFP (n > 1800 puncta), LysoTracker Green (n > 2000 puncta), and eGFP-LC3 n > 110 puncta) were calculated and plotted as black bars. Random co-occurrence (%) is shown as white bars (see METHODS). Mean ± S.E.M. (****p < 0.0001, ***p < 0.001, **p < 0.01, Two-way ANOVA) Statistical source data for b, f, g, h can be found in Supplementary Table 2. All experiments were performed three times with similar results. Unprocessed original scans of blots are shown in Supplemental Fig. 6.
