
Figure 3. Ribophagy in response to mTOR inhibition in HEK293 cells is ATG5-independent but BECN1-dependent.
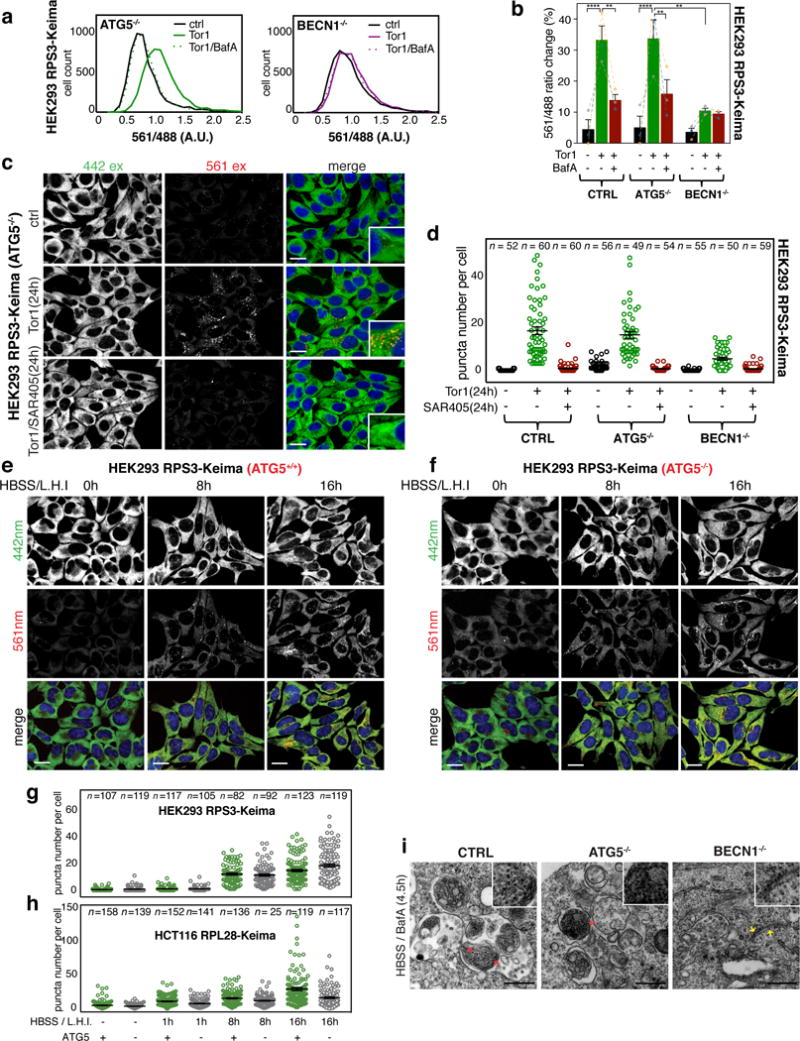
(a) Frequency distributions of 561/488 nm excitation ratios measured on HEK293 RPS3-Keima cells lacking ATG5 or BECN1 were compared after Torin1 or Torin1/BafA treatment using flow cytometry. (n = 10,000 cells per condition) (b) Average 561/488 nm excitation ratios calculated from the biological triplicate experiments from panel a. Mean ± S.E.M. (****p < 0.0001, **p < 0.01, Two-way ANOVA) (c) Confocal images of live HEK293 RPS3-Keima cells lacking ATG5 after Torin1 (150 nM, 24h) or Torin1 (150 nM, 24h)/SAR405 (1 μM, 24h) co-treatment. (Scale bar = 20 μm) (d) Number of red Keima puncta/cell was measured from the live-cell images of HEK293 RPS3-Keima WT, ATG5−/−, or BECN1−/− cells taken after Torin1 (150 nM, 24h) or Torin1 (150 nM, 24h)/SAR405 (1 μM, 24h) co-treatment. Mean ± S.E.M. (Total number of cells from three biologically independent samples are indicated in the graph) (e,f) HEK293 RPS3-Keima cells (with or without ATG5) were incubated with HBSS in the presence of lysosomal hydrolase inhibitors (L.H.I., E64d and Pepstatin, 30 μM each) for the indicated times prior to live cell imaging. (Scale bar = 20 μm) (g) Unbiased quantification of the live-cell images obtained as shown in panels e and f. (h) Unbiased quantification of red Keima puncta obtained from live HCT116 RPL28-Keima cells (with and without ATG5) as shown in Supplemental Fig. 2g,h. In panels g and h, total number of cells from three biologically independent samples are indicated in the graph, and Mean ± S.E.M. is shown. (i) Electron microscopy images of HEK293 RPS3-Keima WT, ATG5−/− and BECN1−/− cells 4.5 h after HBSS treatment in the presence of BafA (50 nM). Red arrow: ribosomes in autophagosomes or autophagolysosomes, yellow arrow: ribosomes bound to ER in cytosol (Scale bar = 500 μm). The data shown represents two independent experiments. Statistical source data for b can be found in Supplementary Table 2. All experiments were repeated at least three times unless otherwise indicated.