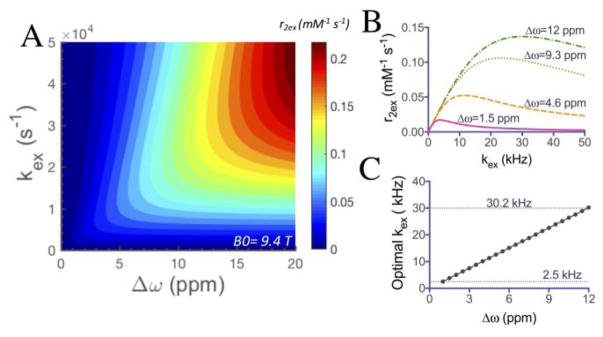
Figure 1.
Simulations with the Swift-Connick equation showing the dependence of T2ex contrast on exchange rates and chemical shifts. A) Simulated r2ex as a function of labile proton Δω and kex at B0 = 9.4 T; B) Simulated r2ex dependence on kex for Δω values of 1.5, 4.6, 9.3 and 12 ppm respectively; C) Optimal kex for the Δω range from 1 ppm to 12 ppm.

