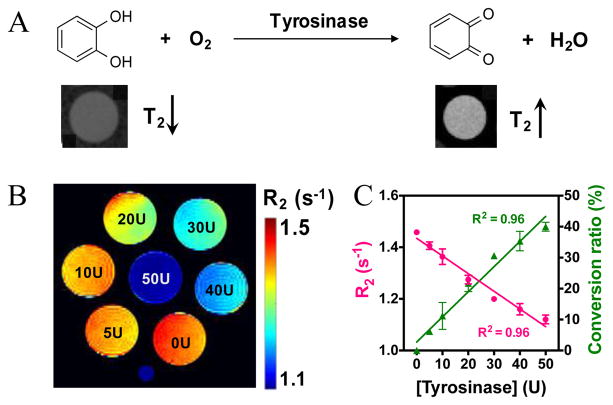
Figure 3.
The Detection of tyrosinase enzyme activity using T2ex MRI. A) Schematic illustration of the conversion of catechol (high T2ex contrast or hypointense MRI signal on the T2w image shown below) to benzoquinone (no T2ex contrast or hyperintense MRI signal on the T2w image shown below) by the catalysis of tyrosinase. B) Pseudo-colored R2 maps of 10 mM catechol solutions (in PBS, 10 mM, pH 6.5), containing different concentration of tyrosinase after reaction for 1.5 h at 25 °C. C) Correlation of transverse relaxation rate and conversion ratio with concentration of tyrosinase. Note: U is the unit of tyrosinase concentration and stands for unit/mL.

