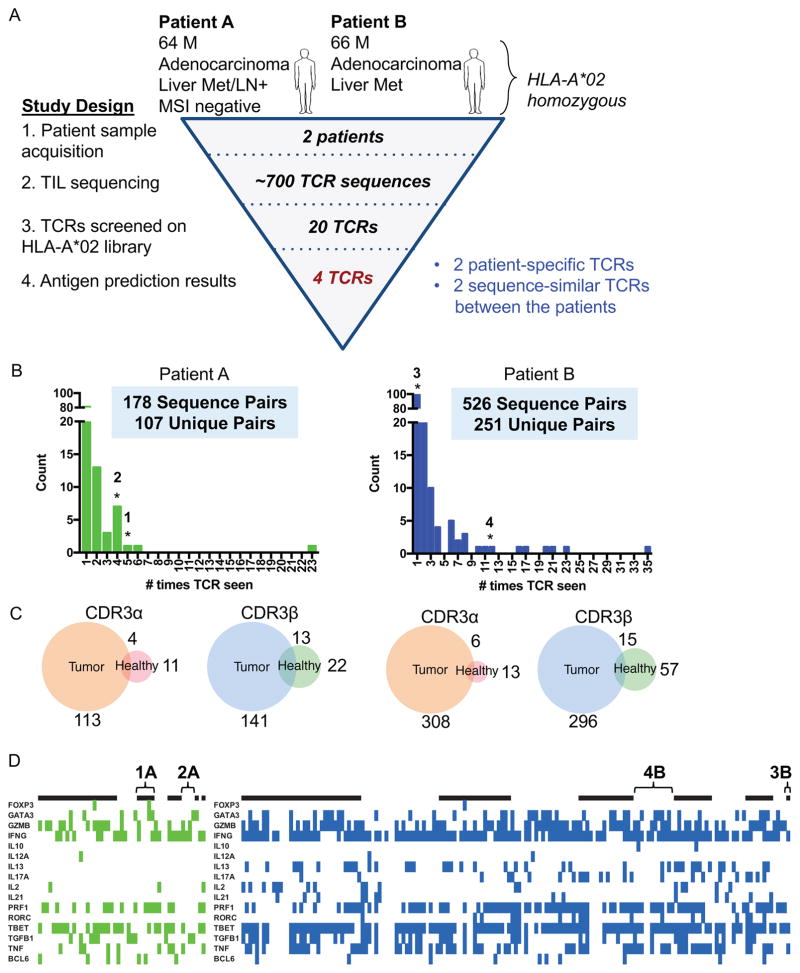
Figure 4.
Profiling TCRs identified in two HLA-A*02 patients with colorectal adenocarcinoma
(A) Study design to de-orphanize patient-derived TCRs on the HLA-A*02:01 library with summarized results.
(B) Bar graph of abundances of unique paired αβ TCR sequences from TILs. * = TCRs that enriched peptides from the library.
(C) Venn diagrams representing the overlap of individual unique CDR3α or CDR3β chain sequences between tumor and healthy tissues for each patient. The number indicates the amount of CDR3 sequences in the nearest section of the Venn diagram.
(D) Heatmaps identifying the binary measurement of transcription factors using sequencing of amplified and barcoded transcripts. The alternating black and white panels indicate boundaries of single T cell clones with the same receptor sequences, with the most abundance clones beginning from the left most side. The left panel identifies those T cells with TCRs chosen from Patient A to be screened and green denoting the presence of transcript. The right panel identifies those T cells with TCRs chosen from Patient B to be screened and blue denoting the presence of transcript. White indicates lack of transcript detected. TCRs 1A, 2A, 3B, and 4B are labeled.

