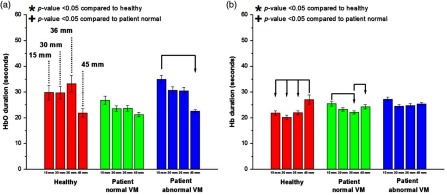
Fig. 7.
Duration for all channels averaged according to source–detector separation. The bars are ordered from left to right from shortest separation (15 mm) to farthest separation (45 mm) for the recorded NIRS duration of (a) HbO and (b) Hb. The duration parameter shows less difference among the groups. Statistically significant values () compared with the healthy group or patient NVM group are depicted by * or +, respectively. Statistically significant values () between distances within a group are connected via arrows.

