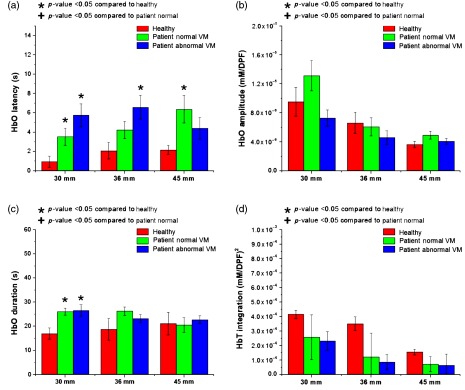
Fig. 9.
Calculated metrics with short channel removed: (a) HbO latency, (b) amplitude, (c) duration, and (d) HbT integration calculated for 30, 36, and 45 mm, with the 15-mm channel regressed from the data. Statistically significant values () compared with the healthy group or patient normal group are depicted as a * or +, respectively.

